I spent the last month building open benchmarks for crypto infrastructure. RPC latency, bridge fees, oracle deviation, stablecoin peg drift, L1 finality, Solana transaction landing rates. Everything is live, backed by Prometheus, the methodology is public, and the harness code is on GitHub. Before I add more providers I want methodology review from people who have thought about this longer than I have. Honestly the state of the field is rough. Every infrastructure benchmark I found falls into one of three buckets: marketing copy published by the provider being measured, a one off blog post with no live data and no methodology, or closed measurements you just have to trust. None of them are reproducible. None publish their sampling cadence, outlier handling, region split, or fetch mechanism. So I built one that does. This is not a launch post. I want technical critique on how I am measuring, not feedback on the UI. Link is at the bottom. The methodology questions are why I am here. Sampling cadence and aggregation Each metric has its own scrape interval. RPC eth_call latency runs at 30s per provider per region. L1 finality wall clock is 10s polling for HTTP only chains, with a persistent WebSocket subscription for BNB and Avalanche so I can record when a block is first seen as latest and when the same block is first seen as finalized, down to the millisecond. Stablecoin peg is 5s on CEX REST tickers and 12s on Curve get_dy onchain. Aggregator head lag is 15s WebSocket event sampling. Samples get bucketed per minute, then aggregated with quantile_over_time across the reporting window (24h or 7d). I publish p50, p90 and p99 separately. The leaderboard sorts on p50 by default because it is the most stable indicator of typical user experience, but the full distribution is queryable from the API and shown on each bench page. For a single 24h window on a daily active metric I currently get roughly 100k to 500k data points per provider depending on cadence. I think that is enough to publish a leaderboard. Am I wrong? Where is the floor for "this comparison actually means something" in your experience? Outlier handling, where I am least confident For latency metrics I currently drop the top 1% per minute bucket before computing the per minute median. The daily p99 is then computed from those per minute medians, not from raw samples. This trims one off spikes (a single GC pause, a single network reroute) without hiding consistent tail behavior. Three providers have already pushed back, in opposite directions. One says I am masking their real worst case (which they argue is still better than competitors with wider tails). Another says I should drop nothing and let the raw distribution speak. A third says I should drop more, top 5%, because they have a known rare failure mode they consider out of scope. I do not have a principled answer yet. The tension is between representing typical experience honestly and letting one network event dominate the number. What do you do? Is there a paper or prior art you would point me to? Multiregion Three of the benches run in three regions: US East, EU West and Singapore. For those the leaderboard reports the median across regions, which hides regional advantages a provider may have. A provider with a single US datacenter and no Singapore edge can look bad on the global number even if it is fast for its actual customer base. A provider that is strong only in EU looks mid tier when measured globally. Right now I expose per region rankings as a filter on the bench page, but the shareable headline is the median across regions. Should this be configurable per provider? Should the headline default to the user's nearest region by geolocation? I have not seen anyone solve this cleanly. Connection reuse For eth_call latency I rebuild the HTTPS connection on every call to measure cold call latency. A few providers argue this is not representative, since in production their clients hold persistent connections and reuse them. They want warm call latency. My reasoning is that cold call is the honest measurement when you do not know client behavior, and it captures TLS handshake overhead, which is a real cost. But warm call is closer to what a long lived application actually sees. Right now I publish cold call as the default and do not publish warm call at all. Right call? Should I publish both? Why Prometheus Two reasons. First, every number on the site is a literal quantile_over_time query. Anyone can hit the HTTP API, pull the raw sample series, and recompute the leaderboard with their own aggregation. Reproducibility is the whole point. Second, it makes adding providers cheap. The harness exposes /metrics with consistent labels, a new entrant opens a PR adding their RPC URL to the config, and the metric shows up automatically with no manual leaderboard edits. The cost is that quantile_over_time is an approximation, not an exact percentile, so it deviates by roughly 1 to 2% from the true percentile on raw samples. For most users that is noise. For a provider sitting 0.5% behind the leader it can be the difference between rank 1 and rank 2. I disclose it, but I know some people consider it disqualifying. Site: https://openchainbench.com/ Github : https://github.com/OpenChainBench/OpenChainBench submitted by /u/Minimum_Abies3578 [link] [Kommentare]


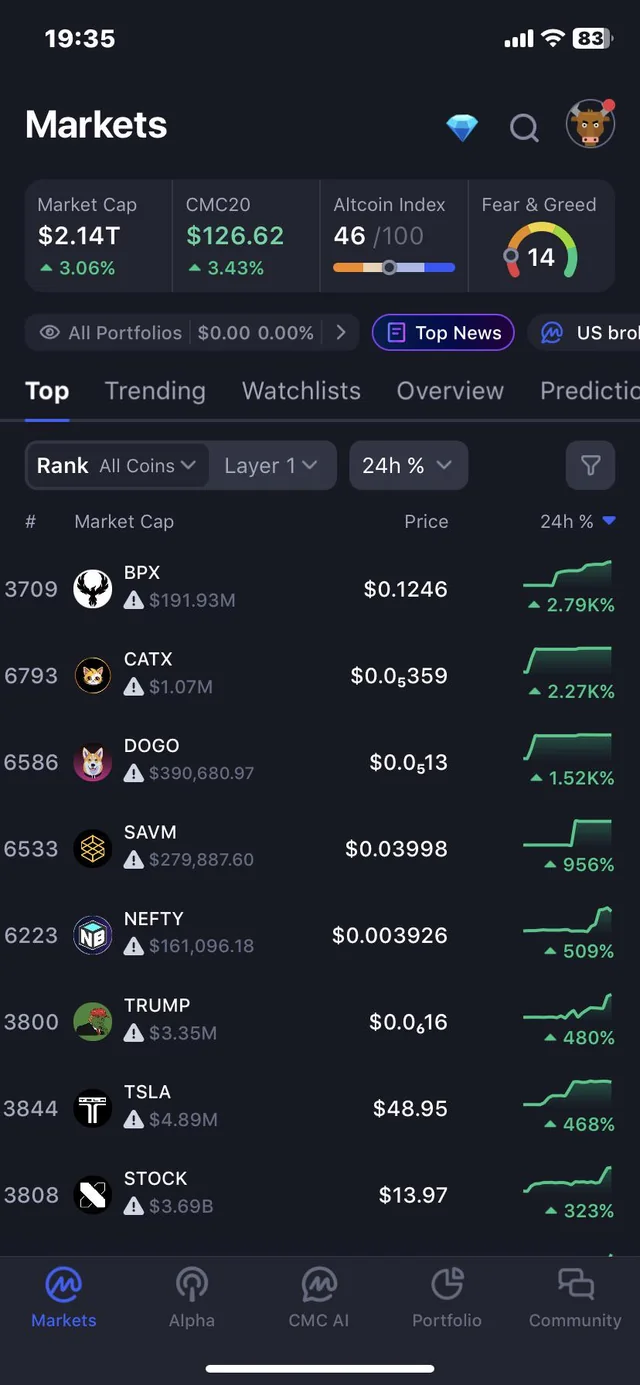
I bought a ton of BTC at 90k, not leveraged but didn’t know about the 4 year cycle before I bought. Anyone any info on how long it’ll take to reclaim since I expect we’ll probably drop to 50k in oct/nov? submitted by /u/012345601234501234 [link] [Kommentare]
Rough week across the board. BTC ~51% off its Oct ’25 high, ETH at 2-year lows, SOL at its lowest since Dec 2023, F&G buried in fear, and ~$1.7B in leverage wiped in a single 24h stretch. Instead of the “is the bull market over” doom takes, I tried to separate what broke from what just sold off. Going through the drivers, almost none of them are crypto-native: • Record ETF redemptions — US spot BTC ETFs logged their biggest weekly outflow ever (\~$3.4B); ETH ETFs are on their longest net-outflow streak on record. Direct bid leaving the market. • Macro risk-off — sticky inflation, stronger dollar, Fed “higher for longer.” Capital rotating to cash/bonds/gold. Every risk asset is getting sold, not just crypto. • Leverage flush — mostly mechanical, longs cascading into liquidation. Painful, but it resets froth. • Cycle psychology — we’re squarely in the part of the 4-year window where sentiment historically sours. What’s not on the list: no protocol failure, no exchange blowup, no broken networks. Chains processing, DeFi functioning, dev activity intact. The one genuinely interesting divergence I can’t stop looking at: while BTC and ETH ETFs hemorrhaged billions, Solana spot ETFs just posted their best month of 2026 (~$15.6M net inflows last week, total SOL ETF assets crossing $1B). Smart money rotating into one name during peak fear is at least worth a conversation. Not calling a bottom — ETH prediction markets are pricing 70%+ odds of a deeper leg down, and BTC’s still in a confirmed downtrend. Just that the cause here reads as liquidity + sentiment, not fundamentals. Where’s everyone landing — capitulation flush, or the start of something worse? And is the SOL flow divergence signal or noise? submitted by /u/sunny8888 [link] [Kommentare]
Whats everyone's thoughts, is this a good time to buy 1 bitcoin? submitted by /u/CompleteMine6873 [link] [Kommentare]

Article highlight. The conclusion frames Bitcoin as capable of serving many roles without belonging to one constituency. It can be money for individuals, capital for companies, collateral for banks, reserves for nations, property for families, infrastructure for markets, and *hope" for people facing economic misery. The preferred path treats the base layer as sacred infrastructure while pushing most innovation into higher layers, applications, custody systems, credit instruments, and capital markets. submitted by /u/zesushv [link] [Kommentare]
If you're still chasing yield in liquid restaking protocols, you're stacking risks like a terrifying game of financial Jenga. The recent Kelp DAO exploit didn't require some nation-state level of cryptographic genius to execute. The attacker simply spotted that the smart contract's withdrawal logic relied on a completely manipulatable spot-price oracle from a single decentralized exchange. I've spent time looking at the raw transaction logs, and the sheer laziness of the math is breathtaking. The attacker flash-loaned millions, artificially pumped the collateral's price in a single block, and the Kelp contract blindly accepted this manipulated, sky-high valuation as gospel truth because it wasn't even built to calculate a time-weighted average price (TWAP). Relying on spot-price valuations inside a single transaction block is like asking a bank robber to appraise the contents of the vault while he's stuffing the cash into a duffel bag. This isn't an isolated incident—it's the exact same architectural rot I see across the entire cross-chain bridge landscape, where a single misconfigured smart contract parameter, a slightly flawed Merkle tree proof implementation, or a lazy developer forgetting to update a simple state machine variable can instantly invalidate the entire security model and allow a malicious actor to mint an infinite supply of counterfeit tokens on the destination chain while the original assets sit completely frozen and useless in the source vault. Complete architectural failure. If you want to stop getting rugged by sleep-deprived devs copy-pasting code, you need to start reading the actual execution traces and mathematical models behind these failures. I've published the full technical autopsy, showing the exact function failures, the exploit payloads, and how this compares to the consensus-level cryptographic proofs used by the Verus Bridge. Stop trusting the dashboards. Start auditing the logic. -James McCabe (ModernCYPH3R) submitted by /u/ModernCYPH3R [link] [Kommentare]
Hi guys, from this insane dip i've sold some stock assets and bought ETH which I plan to hold for at least 3 years without touching it, I know we can stake it and earn passive interests which interests me currently. Problem is, i've digged to make a node and it seems like there's an unstake delay, isn't there a way to stake it without delay during unstaking? Thanks submitted by /u/headgod123 [link] [Kommentare]
In my opinion it is. I’ve been in crypto since 2017 and seen all of it. This time is the first time in almost 10 years that it’s been so long for crypto to become mainstream without becoming, that I think the hype over the technology is over. Btc will probably be around for a very long time and it has a solid use case. The alts though, has now been diminished to stablecoins, prediction markets, tokenized assets, gaming maybe, and some other real use cases. This does not translate to the value of respective chain/layer 2, see Polygon. The time when retail could become rich from it I believe is over. When institutions, governments, stock exchanges etc is fully involved in som way, the complete “buy the rumors, sell the news” has ended. Does this post mark the bottom? I hope so. Because I still have way too much crypto left, but for me I will let it lie there and stake for years if necessary. Luckily I exited a lot last year. I want a serious discussion about what you think about this. submitted by /u/Big_Research5671 [link] [Kommentare]