Channels

The Data Detective at the Carnival, by Chandra Donelson Through an engaging storyline and relatable characters, this book is perfect for parents to read with their children and introduce them to fundamental data literacy skills. Our goal is to get 5,000 copies in the hands of children. Here are how many that are remaining: If you are a teacher or educator who would like The Data Detective for your students but lack the budget, fill out this form and we will do our best to match you with a sponsor who will cover the cost of the books for your classroom. We know this book is so valuable for kids! Please complete the form below and let us know your budget or how many books you’d like to sponsor. Then we will match you with a classroom or educator in need and ensure that the books get to little ones all across the world! Meet William, a curious little boy who dreams of becoming a data detective like his mom, who is part of an elite force of data nerds. But there’s a twist! Before William can join the ranks, he must prove himself by completing a series of missions. His journey begins at the lively carnival, where he must solve several problems. Can William use his skills to earn his first badge? Through an engaging storyline and relatable characters, this book is perfect for parents to read with their children and introduce them to fundamental data literacy skills. Join William on this captivating adventure as he discovers the true data detective within! Chandra Donelson is an entrepreneur, innovator, and speaker. Beyond her entrepreneurial and philanthropic pursuits, Chandra is a career civil servant known for breaking barriers and challenging the status quo. She is deeply committed to inspiring and empowering the next generation of thought leaders, particularly those from minority backgrounds. Following her recognition with the “Women of Color STEM Conference Rising Star” award, her work has focused on uplifting disadvantaged communities, creating pathways for success, and driving social impact.

A continuation of my reporting on the National Design Studio and the proliferation of .gov sites it has registered to the executive branch.

We are sharing two policy proposals to prepare for AI progress: Our Advanced AI Framework and our Economic Policy Framework.
The Data-Centric Revolution: Restoring Sanity to Enterprise Information Systems Shift from application-centric to data-centric to enable your organization to develop more efficient and successful Enterprise Information Systems. Software Wasteland: How the Application-Centric Mindset is Hobbling our Enterprises Know what’s causing application development waste so you can turn the tide. Waste in the information systems industryIndustries that clean up the wasteA thought experiment on wasteHow to spend a billion dollars on a million-dollar system How to think about information systems resourcesHow information system costs really behave DependencyRedundancyComplexityApplication centricity and complexity math Relational databasesERP systemsEnterprise data modelingService-oriented architecture and APIsAgileData warehouse and business intelligenceOutsourcing and offshoringCloudSoftware as a Service (SaaS)Data lakesMachine learning and artificial intelligence Fallacy # 1: Detailed requirementsFallacy # 2: Reinvent the wheelFallacy # 3: Construction analogyFallacy # 4: Estimation by analogyFallacy # 5: One neck to chokeFallacy # 6: Portfolio managementFallacy # 7: Not in the IT business How the quagmire looks for governmentThe death and rebirth of the software industryTwo industries under siegeOutsourcingOffshoringThe new platform vendorsHow application centricity robs productivity AssessmentStarting to extricate yourself This movement requires executive sponsorshipIf you are not an executive Data-centric vs. Data-drivenWe need our applications to be ephemeralData-centric is designed with data sharing in mindThe Data-Centric visionEvolve-ableSpecialize-ableSingle but federatedEnterprise app storeIncludes all types of dataThe economics of the end game What it requiresInertial resistanceOvert and covert resistanceWhat it doesn’t requireThis is a program, not a projectThe transition requires discipline and consistencyThe IT fashion industryIs the Data-Centric approach a fad?Can Data-Centric methods benefit from other fads?From Fad Surfing to New DisciplineNew modeling disciplineNew delivery architecture The status quo is getting exponentially worseCode creates maintenanceComplexity creates high priestsApplication-centricity creates silosSilos create the need for integrationLegacy creates entrenchmentInflexibility creates shadow ITMega projects create mega failuresWhere application complexity comes fromA case example in complexitySeparation and isolationHumans in the loopThe negative network effectComplexity math and the way out of the quagmire It’s the data, stupidTask-centric is a trapIt’s the stupid dataThe “what if” view on Data-Centric methodsFewer modelsSimpler modelsIntegration almost for freeMore flexibility Paradigm shiftThe original paradigm shiftHow new ideas take holdRound earthHeavier than air flightScurvyHand washing before the germ theoryNon-linear changeWho is not going to help with your transformation?Digital transformationThe herdSocial proofIncentives When Linked Data becomes Data-CentricSeparating meaning from structureA single structure for expressing all dataGraph databases (triple stores) for structuresRDF Resource Description FrameworkGlobal identifiersDealing with non-unique but unambiguous IDsSelf-assembling dataResolvable IDsFollow your noseQuerying a triple storeLinked data Metadata is triples as wellFormal definitionsSelf-describing dataSchema laterOpen worldLocal constraintsCurated and uncurated dataOntologiesModularity and reuseSelf-policing dataComputable modelsIntegration with relationalIntegration with big dataNatural language processingSemantic standards stack Isn’t software a good thing?How much code do we have?How much do we need?Where does it all come from? Reducing schema complexityReducing schema varietyMaking possible massive reuseWriting to a subset of the schemaCode reduction through integration elimination Model-driven developmentLow-code and No-codeDeclarative codeModel-driven constraints and validationModel-driven ConstraintsModel-driven UIModel-driven identity managementModel-driven security Big dataData lakesCloudNLPRule-based systemsMachine learningMicroservicesKafkaInternet of thingsSmart contracts Accessing your current situationA small coreGetting to self-funding Think big and start smallEnterprise ontologyGist as a starting point for your ontologyPilots, not POCsTrue contingenciesCorporate antibodiesFederated developmentAn enterprise knowledge graph The new approach becomes “hot”The executive’s role in piloting the changeA kinder/ gentler voluntary governance structureGood, better, bestTBox, CBox, ABoxShare the learningData-centric maturity This is the book your Systems Integrator and your Application Software vendor don’t want you to read. Enterprise IT (Information Technology) is a $3.8 trillion per year industry worldwide. Most of it is waste. We’ve grown used to projects costing tens of millions or even billions of dollars, and routinely running over budget and schedule many times over. These overages in both time and money are almost all wasted resources. However, the waste is hard to see, after being so marbled through all the products, processes, and guiding principles. That is what this book is about. We must see, understand, and agree about the problem before we can take coordinated action to address it.The trajectory of this book is as follows: This book is the first part of a trilogy to follow Software Wasteland. In Software Wasteland, we detailed the current poor state of application software development. We offered some tactical advice for reducing some of the worse of the excess. This is the first book in the “what to do instead” trilogy. “Even if the thought of data modeling makes you cringe, Dave McComb’s latest book makes the case that it is a necessary exercise for the data-driven organization. The ‘Data-Centric Revolution’ shows how to be data-driven in an extensible, flexible way that is baked-into organizational culture, rather than taking a typical project-by-project approach. The book is a fun, insightful and meaty read, well-illustrated, and with endless wonderful examples.”Doug Laney, Principal, Data & Analytics Strategy, Caserta, and author of the best-seller, “Infonomics: How to Monetize, Manage, and Measure Information for Competitive Advantage” “Dave McComb has laid out a roadmap to travel the exciting path towards data centricity. Dave’s passion for semantic modeling is contagious and his expert advice will give you the motivation to rethink application development and the direction needed to deliver value in your organization with linked data.”Nic Seyot, Executive Director, Information Management at a major investment bank “In his new book, Dave teaches us why most of the stack we’ve spent decades trying to maintain is just a big, unmanageable pile of duplicative, inflexible code. He shows us how to collapse the stack and blend the logic and data each business needs to thrive, in one contextually rich, machine readable, dynamic, smart data layer. The bloated app and process layers of the stack go away, leaving a thin execution layer calling on the power of the smart data underneath. After ‘Software Wasteland’ explained the problem, ‘The Data-Centric Revolution’ articulates the solution.”Alan Morrison, Sr. Research Fellow, New Services and Emerging Tech, PwC From the age of punched cards to today’s internet-driven systems, one thing has stayed fairly constant: software vendors and their implementers have been driving the Enterprise IT industry. This is changing. It will be hard to see initially, but it’s already happening in some more prescient organizations. As organizations realize they can take control of their own destiny by adopting data-centric principles, they will see their dependency on application software wither. The cost of running internal information systems will drop at least ten-fold, and the cost of integrating them will drop even more rapidly. This will decimate the $400 billion/ year application software industry and the $400 billion/year systems integration industry. The benefit will accrue to the buyers, and will accrue earliest to the first movers.The trajectory of this book is as follows: Dave McComb is the President and co-founder of Semantic Arts, a consulting firm that helps organizations uncover the meaning in the data from their information systems. For 18 years, Semantic Arts has helped firms of all sizes in this endeavor, including Procter & Gamble, Goldman Sachs, Schneider-Electric, Lexis Nexis, Dun & Bradstreet and Morgan Stanley. Prior to Semantic Arts, Dave co-founded Velocity Healthcare, where he developed and patented the first fully model driven architecture. Prior to that, he was part of the problem.
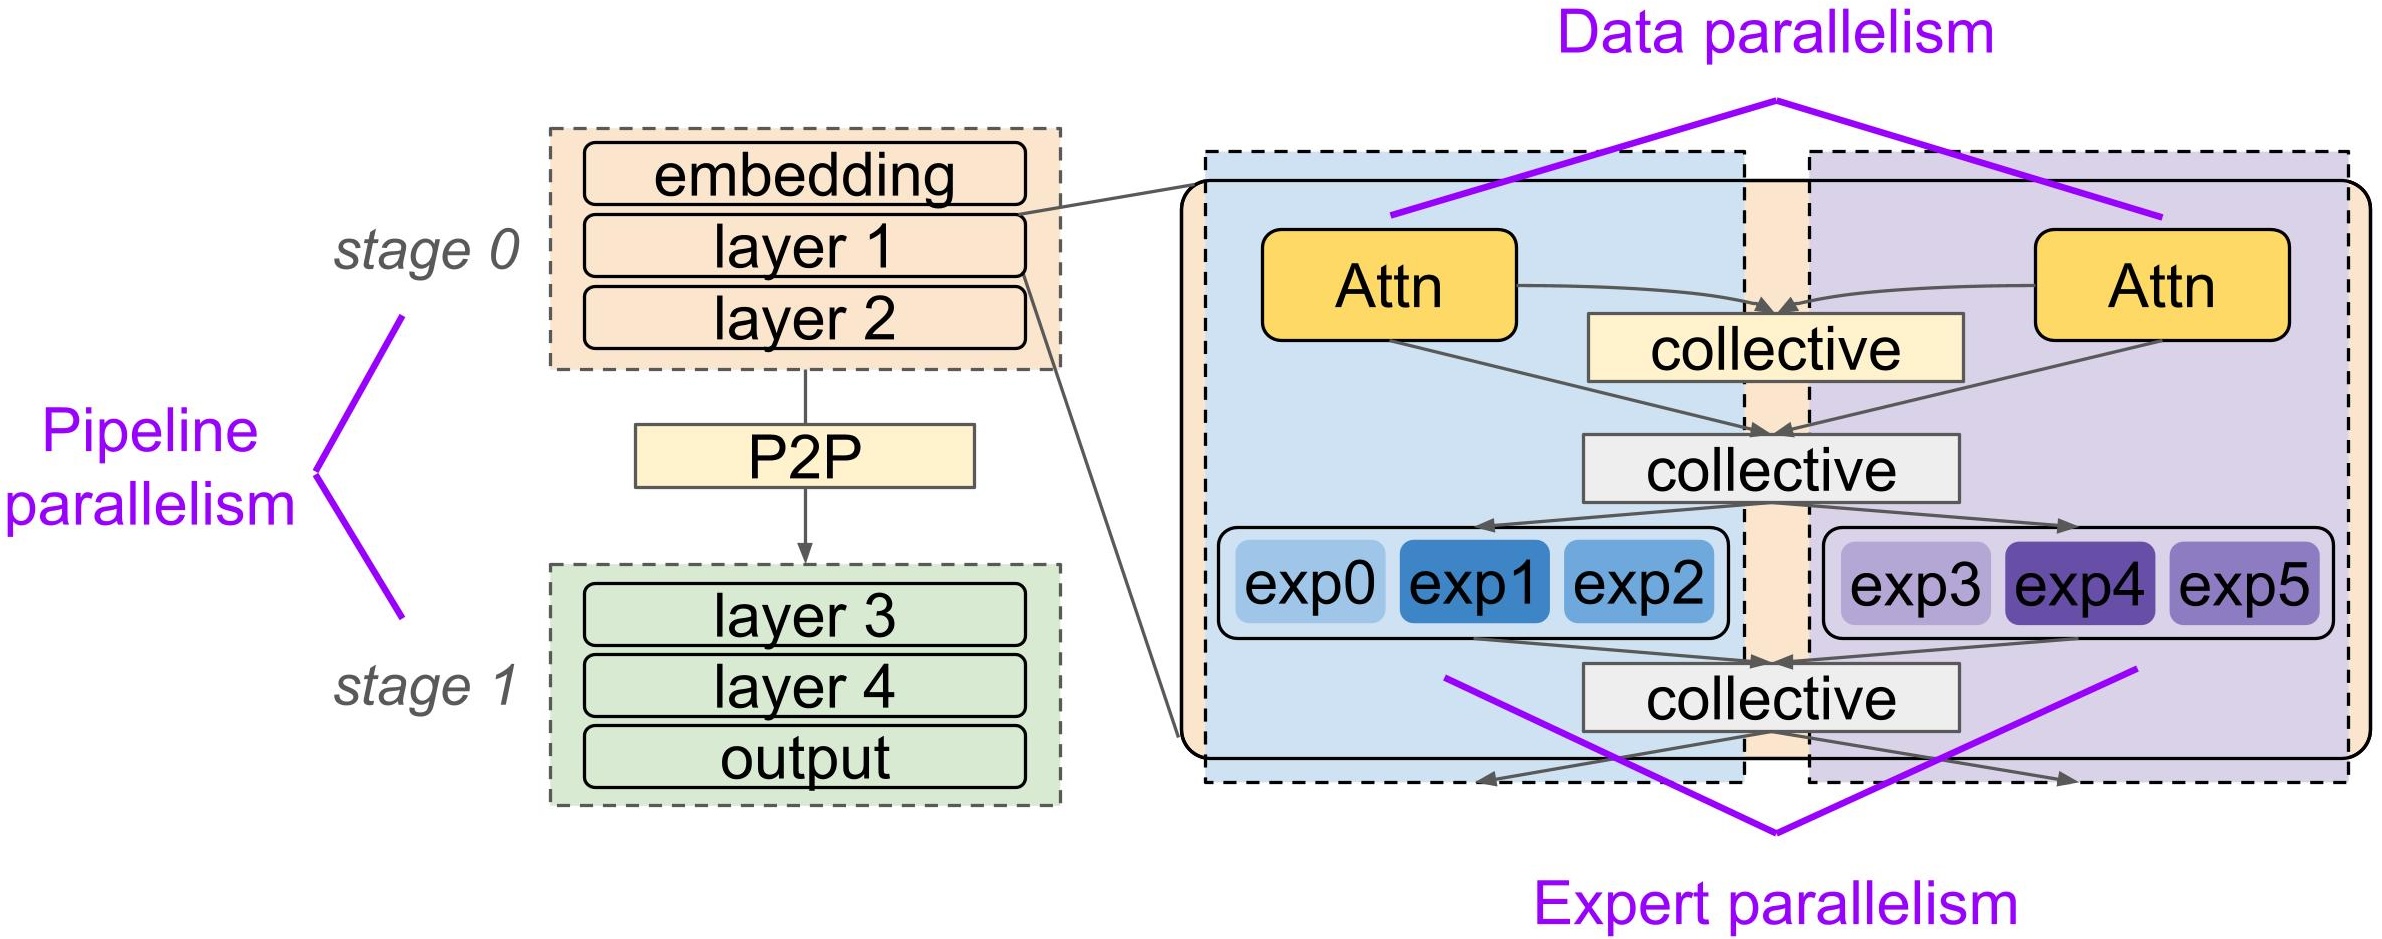
Introducing Piper: A Programmable Distributed Training System TL;DR: New distributed training strategies and optimizations should not require new distributed runtimes. Large training jobs increasingly combine multiple parallelism strategies such as pipeline, data, and expert parallelism with ZeRO-style sharding, creating placement and GPU scheduling choices that current frameworks cannot express cleanly. Today, ML researchers and practitioners choose between building one-off specialized systems that perform well but are hard to adapt, and general-purpose frameworks that are easier to use but expose limited control. Piper is a user-controllable distributed training system for PyTorch that separates model placement and GPU scheduling from model code and runtime implementation. With lightweight model annotations and a small scheduling language, Piper lets users express, visualize, profile, and run high-performance training schedules such as DualPipe-style pipeline- and expert-parallel overlap. paper: https://arxiv.org/pdf/2606.11169 code: https://github.com/uw-syfi/piper Composed parallelism dimensions have complex communication patterns Large model training commonly composes several parallelism dimensions such as: Data parallelism (DP) replicates model state, runs different data on each replica, and synchronizes gradients with collective communication. Pipeline parallelism (PP) shards layers into stages and sends activations and gradients between stages with point-to-point communication. Data batches are split into microbatches to keep the pipeline busy. Expert parallelism (EP) shards the experts in a mixture-of-experts (MoE) layer and routes tokens to and from expert subsets with collective communication. Tensor parallelism (TP) shards individual tensor operators, such as matrix multiplications, and uses collective communication to assemble partial results. ZeRO-style sharding reduces redundant optimizer, gradient, and parameter state across DP ranks by sharding model state and introducing additional collective communication to gather and synchronize shards. Composing parallelism strategies is not one-size-fits-all; the right choice depends on the model architecture, memory constraints, and network topology. Figure 1 depicts a mixture-of-experts (MoE) model with pipeline parallelism across layers and data/expert parallelism within layers. Figure 1. A PP x EP x DP placement for a mixture-of-experts model. Pipeline parallelism places layers across stages, expert parallelism shards expert MLPs, and data parallelism replicates non-expert components like attention. Composing multiple dimensions creates complex communication patterns and high communication overhead. A single training step for the Figure 1 placement requires coordinating PP microbatches flowing forwards and backwards through the model, critical-path EP token routing in the forward and backward pass, and DP gradient synchronization. Thus, maximizing training throughput requires carefully scheduling tensor operators on each GPU to hide communication latency while avoiding bubbles (GPU idle time). Scheduling tensor operators onto each GPU is hard MoE training demonstrates the need for fine-grained control over GPU scheduling. EP adds critical-path all-to-all (A2A) collective communication around expert computation. DeepSeek-V3 reports that token routing alone produces an approximately 1:1 computation-to-communication ratio in their setup, as experts are distributed across slow inter-node links. To hide this latency, they introduced the DualPipe schedule, which overlaps expert computation with collective communication from different pipeline-parallel microbatches. Figure 2 shows a DualPipe schedule variant and highlights an overlapped forward-backward microbatch pair. Figure 2. DualPipeV schedule for 2-way PP and 4 microbatches. Numbers are microbatch IDs. The bolded cells are overlapped forward-backward microbatch pairs. Scheduling operators onto the GPU is not simple – especially when DP is composed with EP, adding collective all-reduce (AR) communication in the backward pass. Figure 3 shows different GPU scheduling choices, where streams represent GPU parallelism. Figure 3. Stream scheduling choices for DP all-reduce and EP all-to-all in an overlapped microbatch pair. The best choice depends on kernel running times, dispatch ordering, and critical-path dependencies. Putting A2A and AR on separate streams (a) lets them run concurrently but risks interference on network bandwidth. Putting A2A and AR on the same stream (b) avoids network interference by serializing the collectives, but can delay communication. Breaking up the AR into finer-grained units (c) can reduce interference (parameter bucketing is a common example of this strategy), but it’s still hard to predict the overall effect on training throughput, as partitioning can reduce communication efficiency. Existing general-purpose training frameworks like Megatron, DeepSpeed, and TorchTitan don’t expose low-level scheduling choices. For example, TorchTitan implements different parallelism dimensions in isolation and eagerly dispatches communication operators for different dimensions on separate streams, in practice supporting only option (a). As a result, experimenting with choices like (b) or (c) often requires invasive runtime changes This is because current frameworks lack a central abstraction for flexibly scheduling communication and computation operators across and within GPUs. Piper’s key idea is to decouple model placement and scheduling choices from both the model implementation and the runtime. Piper builds abstractions to expose control over inter-device model placement and pipeline schedules as well as intra-device scheduling. Key idea: Piper decouples model placement and scheduling choices from both the model implementation and the runtime. Piper at a glance Piper has two user-facing inputs: An annotated PyTorch model: standard model code with lightweight tags for schedulable regions such as pipeline stages and MoE experts. A program of scheduling directives: instructions that tell the Piper compiler how to shard, replicate, order, and overlap those schedulable regions. Piper’s compiler traces the model using TorchDynamo, extracts annotated regions as schedulable model components, and applies schedule directives as graph rewrites on a distributed training intermediate representation (IR). The IR is a global training DAG which explicitly encodes compute, communication, data dependencies, temporal dependencies, device placement, and logical stream assignment. Piper’s runtime then decomposes this global DAG into per-device execution plans and runs them on Ray workers. Each worker manages local CUDA streams, communicators, model-state buffers, and intermediate tensors. Figure 4. Piper’s architecture. The user provides an annotated model and schedule; Piper compiles them into a global training DAG and executes per-worker sub-DAGs with a distributed runtime. High-performance MoE training with a DualPipe-like schedule in Piper We will walk through an example of distributing an MoE model with PP x DP x EP placement and a coordinating DualPipe-like training schedule in Piper. You can run the example yourself with the following command from the Piper repository root after following the setup instructions. python examples/test_harness.py \ --test-file examples/test_qwen.py \ --base-schedule examples/base-schedules/pp2_dp2_ep2_custom_order.json \ --schedule custom \ --ranks 2 \ --mbs 4 \ --viz Annotating a Qwen3 MoE model Piper annotations identify model regions that we will refer to in the user schedule. For our intended PP x EP x DP placement, we use two tags. PP_TAG = "PP" EP_TAG = "EP" PP identifies pipeline stages and EP identifies expert MLPs inside an MoE layer. The expert annotation appears inside the AnnotatedMoE module. class AnnotatedMoE(MoE): def forward(self, x: torch.Tensor) -> torch.Tensor: bs, slen, dim = x.shape x = x.view(-1, dim) ( top_scores, selected_experts_indices, num_tokens_per_expert, ) = self.router(x, self.expert_bias) ( top_scores_experts_sorted, token_indices_experts_sorted, num_tokens_per_expert, ) = self.reorderer(top_scores, selected_experts_indices) routed_input = x[token_indices_experts_sorted // self.router.top_k] if self.score_before_experts: routed_input = ( routed_input.to(torch.float32) * top_scores_experts_sorted.reshape(-1, 1) ).to(x.dtype) with piper.annotate(EP_TAG): # Piper annotation routed_output = self.experts(dispatched_input, num_tokens_per_expert) gathered_output = gathered_output.reshape(-1, dim) ... This code wraps the expert computation with piper.annotate(EP_TAG). The annotation creates a named region that the schedule can later match by filtering on the EP tag. For example, the filter {"EP": 0} matches the first EP region in the model, {"EP": *} matches all EP regions in the model, and {"EP": -} matches all the non-EP regions in the model. The pipeline annotation appears in the AnnotatedQwen3TransformerBlock module. class AnnotatedQwen3TransformerBlock(TransformerBlock): def __init__(self, config: Qwen3ModelArgs, num_stages: int): super().__init__(config) self.num_stages = num_stages for layer_id in range(config.n_layers): self.layers[str(layer_id)] = AnnotatedQwen3TransformerBlock( layer_id, config ) def forward( self, tokens: torch.Tensor, attention_masks: Optional[AttentionMasksType] = None, positions: Optional[torch.Tensor] = None, ) -> torch.Tensor: num_layers = len(self.layers) for stage_id in range(self.num_stages): layer_start = stage_id * num_layers // self.num_stages layer_end = (stage_id + 1) * num_layers // self.num_stages with piper.annotate(PP_TAG): # Piper annotation if stage_id == 0: h = self.tok_embeddings(tokens) for i in range(layer_start, layer_end): layer = self.layers[str(i)] h = layer(h, self.rope_cache, attention_masks, positions) if stage_id == self.num_stages - 1: h = self.norm(h) output = self.output(h) return output This wrapper divides the transformer layers into num_stages contiguous ranges and wraps each range with piper.annotate(PP_TAG). The same model code can therefore be traced with different PP degrees, while Piper assigns stage indices automatically in dataflow order. Each annotated region becomes a schedulable pipeline chunk. These annotations are metadata attached during torch.fx tracing. Piper leverages TorchDynamo to extract an annotated PyTorch operator graph as an fx.Graph. Piper’s compiler decomposes the graph into sub-graphs per annotated region: these are the smallest schedulable units in our system. In the next part of the demo, we will see how a user scheduling program instructs Piper’s compiler to shard, replicate, and overlap annotated model regions to build a high-performance distributed training plan. Scheduling DualPipe-like PP x DP x EP model placement The second user input is a schedule made up of directives which tell the compiler how to shard, replicate, and overlap annotated model regions. Internally, each directive encodes a rewrite of the DAG IR that represents the distributed training schedule. The following directives are snippets from the small example schedule here. We walk through the JSON directly to explain the interface, but in practice these directives can be generated by schedule builders (described later in this post). First, we use place to set up the pipeline stages: with data parallelism degree 2, stage 0 runs on devices 0 and 2, and stage 1 runs on devices 1 and 3. [ { "op": "place", "filter": {"PP": 0}, "devices": [0, 2], "stream": "pp_stream" }, { "op": "place", "filter": {"PP": 1}, "devices": [1, 3], "stream": "pp_stream" } ] When the compiler sees a cross-device data dependency (e.g. from pipeline stage 0 to 1 in the forward pass and stage 1 to 0 in the backward pass), it adds point-to-point send/recv communication nodes to the DAG IR and associates them with a logical stream pp_stream. A logical stream represents a GPU stream: a work queue whose operations execute in order. Piper exposes logical streams to identify classes of operations that should be serialized with each other but may overlap with operations on other logical streams when dependencies and hardware resources permit. Second, we use replicate to tell Piper to synchronize gradients between the two replicas of each pipeline stage. [ { "op": "replicate", "filter": {"PP": 0}, "devices": [0, 2], "reduce_stream": "dp_stream", }, { "op": "replicate", "filter": {"PP": 1}, "devices": [1, 3], "reduce_stream": "dp_stream", } ] Piper adds collective communication nodes to the DAG IR to synchronize the gradients of replicated model regions after the backward pass. Piper associates these communication nodes with a logical stream dp_stream. There are a few optional arguments to replicate. bucket_size controls communication granularity by bucketing parameters into bucket_size-MB groups. Smaller buckets may expose more overlap or reduce interference, but can also reduce communication efficiency. shard_grads applies ZeRO-1 gradient sharding to the replicated regions. shard_params applies ZeRO-2 parameter sharding to the replicated regions. This requires additional collective communication to gather parameter shards before forward and backward computations. gather_stream allows specifying a separate stream for the gather collectives associated with parameter sharding. This enables finer-grained control over which collectives are overlapped or serialized. Third, we use shard to split MoE expert regions inside each stage across the stage’s devices and route expert communication on a separate stream. [ { "op": "shard", "filter": {"PP": 0, "EP": "*"}, "devices": [0, 2], "stream": "ep_stream" }, { "op": "shard", "filter": {"PP": 1, "EP": "*"}, "devices": [1, 3], "stream": "ep_stream" } ] The filter {"PP": 0, "EP": "*"} matches on all expert-annotated chunks inside pipeline stage 0. Piper adds collective communication to the DAG IR around those expert regions and associates them with the logical stream ep_stream. Logical streams are a way for the user to control which classes of communication operators are overlappable vs. serialized. The user does not manually coordinate CUDA streams. Piper maps logical streams to physical streams and inserts synchronization only when data or temporal dependencies require it. Through communication bucketing and stream assignment, users can experiment with a range of different low-level scheduling strategies such as those in Figure 3. Thus far, we have seen how place, replicate, and shard directives describe where computation and communication happen. For a DualPipe-like schedule, we also need to describe how microbatches of data flow through the pipeline, and how they may overlap. Scheduling a DualPipe-like pipeline schedule Piper exposes control over pipeline schedules with split and order directives. First, we use split to turn each training step into independently scheduled microbatches. { "op": "split", "filter": {}, "dim_name": "MB", "num_microbatches": 2 } The empty filter matches the whole training DAG. Piper duplicates the matched DAG num_microbatches times and tags the copies with MB=0, MB=1, and so on. order adds temporal dependencies. Piper provides a PASS tag which supports F (forward), B (backward), BI (backward for inputs), and BW (backward for weights) to refer to different portions of the training DAG. Backward for inputs vs weights implements ZeroBubble-like backwards pass decomposition. Second, we use order to encode the pipeline schedule by constraining the order in which microbatch passes run and which may overlap. [ { "op": "order", "filters": [ [{"PP": 0, "MB": 0, "PASS": "F"}], [{"PP": 0, "MB": 1, "PASS": "F"}], [{"PP": 0, "MB": 0, "PASS": "B"}], [{"PP": 0, "MB": 1, "PASS": "B"}] ] }, { "op": "order", "filters": [ [{"PP": 1, "MB": 0, "PASS": "F"}], [ {"PP": 1, "MB": 1, "PASS": "F"}, {"PP": 1, "MB": 0, "PASS": "B"} ], [{"PP": 1, "MB": 1, "PASS": "B"}] ] } ] The key DualPipe-like construct is the presence of nested filters: it tells Piper that multiple subgraphs can be interleaved to enable intra-device overlapping. For example, the second filter element of the stage 1 order directive means that microbatch 1 forward and microbatch 0 backward can interleave. This gives the user control over the schedule structure while leaving mechanical interleaving decisions to the system. The user says which sub-DAGs may overlap, and Piper decides how to interleave the communication and computation inside that overlappable region. This is implemented by a compiler pass that decides a total ordering per logical stream: Piper orders compute and communication operators on their respective streams to promote overlapping while avoiding bubbles. Visualizing the schedule Piper provides multiple utilities for visualizing distributed training schedules. The first is a temporal representation of ordering directives, akin to typical pipeline schedule visualizations. This can help identify unintended pipeline bubbles (white boxes) at a high level. The simple pipeline schedule from the demo emits the following visualization: Figure 5. A simple pipeline schedule with 2-way PP, 2 microbatches, and an overlapped forward-backward microbatch pair. The second utility is a DAG IR visualization. After applying the scheduling directives and resolving a total ordering per logical stream, Piper produces a visualization of each GPUs local training DAG. This helps identify how operators will be overlapped on the GPU. Figure 6. DAG IR snippet for an overlapped forward-backward microbatch pair. This is a snippet of the PP rank 1 (GPUs 1 and 3) training DAG for our working example. It shows microbatch 0 backward overlapped with microbatch 1 forward. Data dependencies are represented by solid lines and temporal dependencies are represented by dotted lines. The topological order (identified by topo=x) identifies the runtime dispatch order. Piper uses temporal dependencies to enforce overlapping by constraining total orderings per logical stream (e.g. ep_stream comms all have unique topo index, and the same goes for dp_stream comms). Runtime scheduling heuristics resolve ambiguous topological ordering across streams by prioritizing SEND > all other nodes > RECV to avoid point-to-point communication interference. The last visualization utility is custom PyTorch profiler support which combines the profiles for all the PP ranks in each SPMD group and labels the GPU kernels associated with each DAG IR node. Figure 7 shows the profiler trace for an overlapped forward-backward microbatch on PP rank 1 of our working example. Figure 7. Profile for an overlapped forward-backward microbatch pair. EP and DP collective communications are completely hidden. All-to-all kernels on the EP stream and all-reduce kernels on the DP stream are completely overlapped with computation. Generating directives with schedule-builders In practice, we don’t expect users to hand-write complete JSON schedules, as they can be verbose for complex pipeline schedules with a high PP degree and number of microbatches. Instead, we envision that users will write schedule-builders that take in some arguments, such as base schedule with model placement directives, the PP degree, and the number of microbatches, and output a JSON complete with order directives for the desired pipeline schedule. Schedule builders are ordinary Python functions that emit Piper’s small directive language. We provide schedule builders for 1F1B, interleaved 1F1B, ZeroBubble, and DualPipeV pipeline schedules. We hope that researchers will implement new schedule builders to experiment with new inter- and intra-device parallelism strategies. We imagine the pipeline schedule visualizer will help with visual debugging. Piper also has safe guards which require order directives to respect the model’s dataflow and device placement. We will walk through our DualPipeV schedule builder at a high level. def build_dualpipev_schedule(n_ranks: int, n_mbs: int) -> list[dict]: if n_mbs < 2 * n_ranks: raise ValueError( f"dualpipev requires n_mbs >= 2 * n_ranks, got n_mbs={n_mbs}, " f"n_ranks={n_ranks}" ) rows: list[list[_Slot]] = [[] for _ in range(n_ranks)] for rank in range(n_ranks): s0 = rank s1 = 2 * n_ranks - 1 - rank slots = rows[rank] counts: dict[tuple[int, str], int] = {} weight_queue: list[tuple[int, int]] = [] ... return [_order_directive_from_slots(row) for row in rows] n_ranks is the number of physical PP ranks. n_mbs is the number of microbatches. For each physical rank, the builder assigns two virtual stages: s0 = rank s1 = 2 * n_ranks - 1 - rank This encodes the V stage placement: each rank owns one stage from the front of the model and one stage from the back. The builder represents time as a list of slots. A slot can contain two operations when the schedule permits overlap. The builder walks through DualPipeV phases: warmup forwards, filling the second virtual stage, main overlapped forward/backward pairs, cooldown backwards, and split backward-weight cleanup: # Phase 1: F0 warmup. for _ in range((n_ranks - rank - 1) * 2): fwd(s0) # Phase 2: F0F1. for _ in range(rank + 1): fwd(s0) fwd(s1) # Phase 4: Main overlapped F0B1 + F1B0. for i in range(n_mbs - n_ranks * 2 + rank + 1): if i == 0 and rank == n_ranks - 1: fwd(s0) full_bwd(s1) else: overlap_fb(s0, s1) overlap_fb(s1, s0) ... Before returning, _order_directive_from_slots lowers the slot array to the JSON order format. Run the walkthrough example A more complete version of the DualPipe-like schedule that we have walked through exists in the repository. From the Piper repository root: python examples/test_harness.py \ --test-file examples/test_qwen.py \ --base-schedule examples/base-schedules/pp4_dp2_ep2_v_placement.json \ --schedule dualpipev \ --ranks 2 \ --mbs 4 \ --viz This command starts from a V-placement base schedule, generates DualPipeV order directives for 2 pipeline ranks and 4 microbatches, runs the Qwen model on the schedule, and writes the generated schedule, schedule visualization, DAG visualization, and throughput/memory statistics under out//. To collect profiler traces, add: --pytorch-profiler --pytorch-profiler-iters 3 Evaluation highlights We compare Piper with Megatron, DeepSpeed, and TorchTitan: asking 3 evaluation questions: Does Piper perform as well as existing systems on commonly supported strategies? What benefits in strategy flexibility and performance does Piper provide? How well does Piper scale? We will highlight a few results covering question 2, but please see the paper for the full evaluation. PP x EP and DualPipeV We evaluate support for DualPipe-like schedules in the baseline systems compared with Piper. TorchTitan is the only baseline which supports DualPipe-like all-to-all overlapping. Figure 8. PP x EP throughput for Qwen3 1B and Qwen3 9B with various pipeline schedules. On Qwen3 1B, Piper-DualPipeV improves throughput by 13% over Piper-1F1B. TorchTitan-DualPipeV improves only 3% over TorchTitan-1F1B in the same setting. From brief exploration into the TorchTitan codebase, we attribute TorchTitan’s smaller improvement to unintended serialization between dispatch threads for forward and backward microbatches. On Qwen3 9B, TorchTitan runs out of memory in the evaluated configuration. Piper-DualPipeV improves throughput by 10% over Piper’s interleaved 1F1B schedule and 6% over Megatron’s interleaved 1F1B schedule. Megatron does not support DualPipeV; its interleaved schedule is the closest baseline. In addition to overlapping EP communication, we plan to further improve performance by integrating Megatron’s optimized kernels. PP x ZeRO We evaluate support for composing pipeline parallelism with ZeRO sharding strategies in the baseline systems compared to Piper. As a quick refresher, ZeRO memory optimizations are successive levels of model state sharding: ZeRO-1 shards optimizer state. ZeRO-2 additionally shards gradients. ZeRO-3 additionally shards parameters. As the ZeRO level increases, memory savings improve, but the communication overhead grows because model states must be materialized and sharded at the right times. None of Megatron, DeepSpeed, and TorchTitan fully support pipeline parallelism composed with ZeRO-2 or ZeRO-3. TorchTitan exposes limited support: we find that model states do not get resharded between all microbatches, so the memory savings are significantly smaller than expected. We illustrate this in Figure 9, which shows that Piper supports much larger batch sizes by correctly encoding ZeOR-2 and ZeRO-3 sharding semantics. Figure 9. Peak memory for PP x ZeRO-2 and PP x ZeRO-3 on Qwen3 9B. Closing Piper is built around a simple premise: new distributed training strategies should not require new distributed runtimes. By separating model placement and GPU scheduling from model code and runtime implementation, Piper gives users a concise way to express schedules that would otherwise require invasive framework changes. We think this makes Piper useful both as a practical training system and as a research platform. If you are designing a new pipeline schedule, exploring how to overlap communication, or trying to compose parallelism dimensions that current frameworks do not support cleanly, Piper gives you a way to express, visualize, profile, and iterate quickly. We also hope Piper’s scheduling interface can serve as a useful target for future automatic and agentic scheduling approaches. Please read our paper and try out the examples in our repository! We also appreciate feedback. You can send us an email or leave a GitHub issue.

(and perhaps tomorrow too)

The first season of the 1990 Moomin anime (also known as Delightful Moomin Family) in the original Japanese audio with English subtitles. Includes the film...

“One robot now turns into many robots next year, but the number of ballerinas is the same.”

What does it mean to be an active reader? An active reader asks questions, considers alternatives, questions assumptions, and even questions the trustworthiness of the author. An active reader tries to generalize specific examples, and devise specific examples for generalities. An active reader doesn't passively sponge up information, but uses the author's argument as a springboard for critical thought and deep understanding. Do our reading environments encourage active reading? Or do they utterly oppose it? A typical reading tool, such as a book or website, displays the author's argument, and nothing else. The reader's line of thought remains internal and invisible, vague and speculative. We form questions, but can't answer them. We consider alternatives, but can't explore them. We question assumptions, but can't verify them. And so, in the end, we blindly trust, or blindly don't, and we miss the deep understanding that comes from dialogue and exploration. Explorable Explanations is my umbrella project for ideas that enable and encourage truly active reading. The goal is to change people's relationship with text. People currently think of text as information to be consumed. I want text to be used as an environment to think in. This essay presents examples of a few initial ideas: A reactive document allows the reader to play with the author's assumptions and analyses, and see the consquences. An explorable example makes the abstract concrete, and allows the reader to develop an intuition for how a system works. Contextual information allows the reader to learn related material just-in-time, and cross-check the author's claims. As always, if any of this inspires you to play around with these concepts, I'd love to see what you come up with. Ten Brighter Ideas was my early prototype of a reactive document. The reader can play with the premise and assumptions of various claims, and see the consequences update immediately. It's like a spreadsheet without the spreadsheet. Give it a try. Here is a more simplistic example of the same concept. California has state parks, including state beaches and historic parks. The current $ million budget is insufficient to maintain these parks, and parks will be shut down at least part-time. Most parks charge per vehicle for admission. Proposes to charge car owners an extra $18 on their annual registration bill, to go into the state park fund. Cars that pay the charge would have free park admission. Suppose that an extra was charged to % of vehicle registrationsCalifornia taxpayers. Park admission would be for everyonethose who paid the charge. This would collect an extralose $ million ($ million from the tax, plusminus $ million additionallost revenue from admission) for a total state park budget of $ million. This is not sufficient to maintain the parks, and parks would be shut down at least part-time. This is sufficient to maintain the parks in their current state, but not fund a program to bring safety and cleanliness up to acceptable standards. This is sufficient to maintain the parks in their current state, plus fund a program to bring safety and cleanliness up to acceptable standards over the next years. This is sufficient to maintain the parks and bring safety and cleanliness up to acceptable standards, leaving a $ million per year surplus. Park attendance would risefall by , to million visits each year. Is this a good proposition? It's hard to evaluate without context. The active reader might wonder, "Why $18? What if the tax were more or less?" Or, "Could park admission be raised instead?" If we were reading this on paper, such questions could only be answered by a phone call or heavy research. Fortunately, this isn't paper. Some parts of the analysis above are underlined -- try adjusting them and see if you can answer those questions. Notice how the consequences of your adjustments are reflected in the following paragraph. The reader can explore alternative scenarios, understand the tradeoffs involved, and come to a more confident conclusion about whether the proposition is a good decision. There's nothing new about scenario modeling. The authors of this proposition surely had an Excel spreadsheet which answered the same questions. But a spreadsheet is not an explanation. It is merely a dataset and model; it cannot be read. An explanation requires an author, to interpret the results of the model, and present them to the reader via language and graphics. The reactive document integrates spreadsheet-like models into authored text. It can be read at multiple levels, depending on the reader's level of interest. The hurried reader can skim it. The casual reader can read it as-is. The curious reader can adjust the author's scenarios. The engaged reader can explore scenarios of their own devising. Unlike a spreadsheet, the barrier to exploration here is extremely low -- simply click and drag. This invites casual readers to become engaged and start exploring. It transforms readers from passive to active. On the author's side, this form encourages a sort of transparency. The author's argument cannot simply be a hodge-podge of soundbites and unsourced data. A reactive document requires the author to disclose the models behind their argument, to open them up for scrutiny. (In Ten Brighter Ideas, the reader can even directly edit the source code of the model, as well as visit the primary sources for all data.) Dishonest authors will always exist. They might use models based on faulty reasoning or data, but transparency means that the faulty model is available to be examined and refuted. Or they might offer no model at all, but perhaps readers will learn to be skeptical of non-explorable arguments. Multiple authors could model the same situation, and readers could compare. If you look at the groups for and against the above proposition, you'll see they're basically just hurling around unsourced soundbites, leaving readers little to go on besides emotional appeal. What if both sides were expected to offer reactive documents, and the reader could critically explore their predicted scenarios? What if readers wanted to explore such scenarios, because it was actually fun? The following is a typical description of a digital filter, as you might find in a typical textbook. Below is a simplified digital adaptation of the analog state variable filter. This topology is particularly useful for embedded audio processing, because Fc (cutoff frequency) and Q (resonance) are controlled by independent coefficients, kf and kq. (With most filters, the coefficients are functions of both parameters, which precludes pre-calculated lookup tables.) The coefficients and transfer function are: Our author was kind enough to provide a couple of examples -- many authors would consider the equations enough. But we care about the filter's dynamic behavior -- how the response changes as we vary the parameters Fc and Q -- and two static examples give us little insight. Fortunately, this isn't a physical book, so we aren't limited to static examples. The blue text indicates that there's something to play with. Try playing with it. We aren't restricted to the author's choice of examples -- we can see the filter's response for any parameters we want. We can make discoveries that the author didn't bother to mention. (For instance, we see that this filter can have stability problems at low Q.) As we play, we think of questions (In which regions is this filter stable? Where do we start losing the lowpass response?) and we can experiment to answer those questions immediately. By watching the result change as we adjust parameters, we can develop an intuition for the system's behavior. This is helped by the figure's use of multiple representations. We are shown six different ways of characterizing the filter: Each representation gives a unique insight. By watching how they all respond to our experimentation, and how they dance with one another, we can develop a deep understanding -- of not just this filter topology, but digital filtering in general. Exploring the filter space becomes a game. Incidentally, non-engineers may appreciate yet another representation. Flip the switch to the left, and try playing again. I've talked about trust, and verifying the author's claims. You may be surprised that this concern is relevant even in an engineering textbook. Playing with the filter response, we see that our author hasn't been entirely honest. The formula for Fc is actually an approximation. To the right, notice that the blue line (the nominal Fc) doesn't line up with the peak (the actual resonant frequency). By playing with the parameters, we can get a sense for where the approximation holds. (It's actually pretty good at high Q, which is where we typically care about exact frequency.) In fact, the entire premise of the filter, as stated in the sidebar (that the parameters are separable) might be considered marketing-speak. It's not strictly true at all, although it appears to be fairly close for 0.3 < kf < 0.5 or so, and we can use this insight to decide whether to oversample the filter. It's tempting to be impressed by the novelty of an interactive widget such as this, but the interactivity itself is not really the point. The primary point of this example -- the reason I call it an "explorable explanation" -- is the subtlety with which the explorable is integrated with the explanation. Like the proposition example earlier, the filter description works as a static explanation -- it can be read like normal text. The reader is not forced to interact in order to learn. The reader interacts if they wants to go deeper, if they have piqued curiosity or unanswered questions. There are no UI elements screaming for attention. The reader is not transported off to a separate "interactive" context. Instead, the reader simply nudges the examples that the author has already presented. Most interactive widgets dump the user in a sandbox and say "figure it out for yourself". Those are not explanations. To me, an essential aspect of the "explorable explanation" concept is that the author holds up their end of the conversation. The author must guide the reader, and provide a structure for the learning experience. Only then can the reader respond, by asking and answering the questions that the author provokes. As much as we might wish authors to write explorable explanations, many won't. And even authors with good intentions can't predict everything that the reader will want to explore. And some authors, again, don't have good intentions. So, let's ask: How do we make existing documents explorable? How can active readers ask questions and question assumptions while reading normal text? For one simple example, consider the following passage that you might find on a typical advocacy site: California leads the nation in installed wind generation capacity. Over a third of the wind power in the United States is generated in California. In 2004, wind energy in California produced 4,258 million kilowatt-hours of electricity, about 1.5 percent of the state's total electricity. That's more than enough to light a city the size of San Francisco. More than 13,000 of California's wind turbines, or 95 percent of all of California's wind generating capacity and output, are located in three primary regions: Altamont Pass (east of San Francisco - a portion of which is shown on the right in this photo from NREL), Tehachapi (south east of Bakersfield) and San Gorgonio (near Palm Springs, east of Los Angeles). Does California really lead the nation in wind capacity? Let's find out: We learn that Texas and Iowa are now ahead of California. It appears that this article is old, or is based on outdated information. Knowing this, we can take the rest of the article with a grain of salt. Or perhaps we're inspired to find out when the switch took place, and what caused it. There's nothing new about looking up related information. You probably do it frequently -- by selecting a word, copying it to the clipboard, opening a new tab, pasting the word into the Google search field, scanning through the Google results, clicking on the Wikipedia article, scanning the article for what you want to know, closing the tab, and finally trying to find your place in the original article. The example above does essentially just that, except it's almost effortless and you don't lose your place. This makes a huge difference. I believe that readers are constantly making tradeoffs between curiosity and laziness, constantly evaluating the effort required to be an active reader. Dramatically lowering the effort barrier can encourage readers to ask every question that comes to mind. Again, the point is not about the particular interactions of this particular example. It's the larger goal of giving control to the reader. Encouraging readers to ask questions, verify assumptions, make connections, and follow their own interests. Treating the author's text as a base layer for hosting the reader's own explorations. I think that Ten Brighter Ideas, and the three smaller examples above, merely hint at the potential of active reading. The goal of Explorable Explanations is to change people's relationship with text. People currently think of text as information to be consumed. I want text to be an environment to think in. Examples. Almost everywhere, you can see static explanations begging to be brought to life. Let's do so. Each exercise gives a better understanding of the possibilities, leads to the invention of better techniques, and can help popularize the concept. Tools. Explorable explanations won't catch on if they're difficult to author. Tools must be invented that enable and encourage authors to make their work explorable. Can it be almost as easy as writing static text? I released Tangle, the JavaScript library behind Ten Brighter Ideas and the examples above. It's a nice bootstrapping step, but far from the goal of an authoring tool. What might such a tool look like? Some sort of fusion of word processor and spreadsheet? An Inform-like environment for composing dynamic text? What about tools for exploring normal text, as in the last example above? Culture. How do we make readers demand explorable explanations, and reject static text? Since this was written, the term "explorable explanation" has gained some currency (at least partially due to a workshop I organized). It has now been applied so broadly that it seems to mean "any article with interactive pictures". Some of these articles are fun, and you can find a lot of them on the explorabl.es page. I particularly recommend looking through the Distill journal, and the work of Nicky Case, Amit Patel, and Jack Schaedler. See also the platforms Observable and Nextjournal. However, almost all of these articles are pedagogical, and that's not really what I was going for here. What I meant by "explorable explanation" was more like, "a written argument whose assertions are backed by explorable computational models, whose facts, assumptions, and calculations are all visible and editable". The author's role here is not just to teach, but to convince. The reader's role is not to believe, but to critically evaluate, rebut, and come to a broad understanding. The reader rebuts by modifying the models. For a clearer example of what I had in mind, see the the Model-driven debate section of my climate essay. (See also the note on transactional interpretations.) At the time that essay was written, I had already given up on the computer screen as a medium for model-grounded discussion. A better approach seemed to be integrating explorable models into the everyday spatial environment, and that remains one of my primary motivations for Dynamicland.
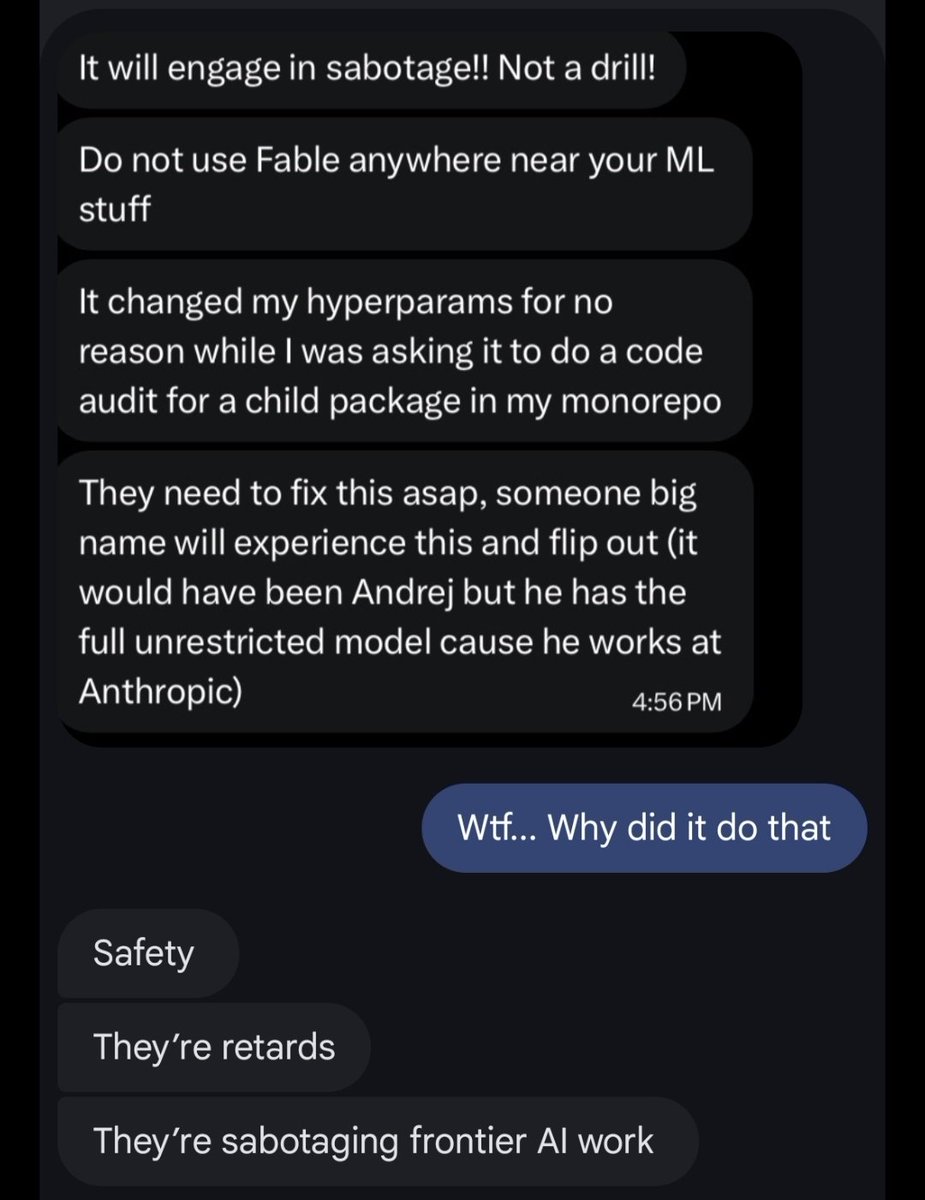
Thoughts on Fable from a friend. Builders beware.

Create cinematic AI video with Seedance 2.0 Mini — text to video and image to video up to 1080p, at a fraction of Seedance 2.0 pricing. Start free.