 M
↗
M
↗
9 months in: building an advanced StarCraft reporting tool with Go & ClaudeJul 14, 2026How it startedWhen I was 15, I met my best mate at a LAN party in downtown Buenos Aires, right as the StarCraft: Brood War craze was catching fire. We fell in love with the game on the spot.It’s 2026 now, we have jobs and live on opposite ends of the world, but we still Zoom almost every weekend to play and mess around. And through that decades-long passion came an idea.The idea, on a weekend call“What if we could just ask an AI in natural language about the game we’d just played?”e.g.:Does this guy always go Carriers?Did all 3 of them ally against us last game?What’s the average time I should have turrets against this particular Zerg?The natural shape for that is an MCP server , but what do we feed to it?Brood War writes a replay file (a .rep) after every game, which lets the game client play the game back to you. But MCP doesn’t read StarCraft replay files.So I went looking for parsers, and András Belicza’s screp was the natural choice (which is already written in Go).Thus, screpdb was born:Parse replays using screpStructure the output and ingest it onto a relational database (SQLite)Put an MCP server in frontThe first commit landed on September 30th, 2025.From chatbot to reporting toolThen we actually used it for a couple of sessions, and something felt off. Typing questions to a chatbot was an impedance mismatch. The first version: Claude querying screpdb over MCP and drawing its own chart. Powerful, but asking a chatbot to rebuild every view, every time, got old fast.What we wanted wasn’t a conversation. It was a reporting tool.However, that’s a much bigger build. Before I’d get into that, I’d want to see what options already existed.The tools that already existedBWChart is the pioneer tool we all used since 2003. Its last update was in 2017, after which SCRChart (below) superseded it. Its Liquipedia page has the full history.SCRChart is the 2019 heir to BWChart, though it seems to have been abandoned later that same year. Being a Java application, it’s cross-platform.RepMastered is András Belicza ’s excellent web database and in-browser analyzer, built on his screp parser, which this whole project stands on (intro thread ). It holds over 100 million replays and is fully featured:Bulk-upload and share replays, even whole folders at once.A huge, filterable database: search by player, map, matchup, or tag.In-browser analysis: APM/EAPM, hotkeys, build-order and strategy charts, and an animated map replay.vespene.gg is the newest arrival (2026) and the boldest: according to its creator, dethsc, responding to my question in the intro thread on TL.net , it’s a fresh reverse-engineering of SC:R’s binaries, which lets you upload a replay and watch the game in-browser, with all kinds of real-time metrics, an AI coach, a replay database, tournaments, Twitch streams and more.These are great tools. But what we needed wasn’t quite covered. We wanted to see higher-level semantics during our play sessions.But before building the reporting tool, I had to learn how tricky it was to get semantics from a replay file.Why StarCraft replays are secretly, wonderfully hardA StarCraft replay does not record what happened. It records only the commands: the stream of orders each player issued.The engineering of the game engine and replays is fascinating, but it’s not the focus of this article; if you’re interested, I vibe-coded this didactic site that goes deeper into it while staying approachable: Inside Brood War .In short: in order to know what really happened in the game, you’d need to run the commands against the game engine, but as of SC:Remastered, there’s no headless API to do this (BWAPI & OpenBW exist for pre-remastered but come with tradeoffs; dethsc’s reverse-engineering of Remastered is closed source).This means that certain things just cannot be answered from replays alone:How many resources does each player have over time? Is a player supply-blocked right now?A unit was created, but was it killed later? Was a building destroyed?A unit was ordered to go somewhere, but was it able to arrive there? When?And the commands themselves are noisy:Spam. Plenty of orders were recorded but rejected by the engine (not enough resources, cancelled builds, a worker killed on the way), and we often can’t tell which ones actually happened.Missing data. Commands that ought to carry coordinates, or a source unit or target, frequently just don’t.Ambiguous units. Units are identified by a recyclable 16-bit “unit tag”, not a type, so it’s often impossible to say which unit did what.But then AI started getting so good, so fast, that I could prototype things that would have been impossible back when BWChart and SCRChart were built.So, how do you get semantics anyway?Here are the main techniques screpdb uses to turn that messy command stream into meaning.💎 Understanding the map with base polygonsThis is a big one.screpdb leans on a companion library I wrote, scmapanalyzer , which carves each map into base polygons, one per start location and expansion, each with:the polygon outlining its ground areaits centroid, and the path to its natural (for start locations)its clock position (“at 5”)flags like “mineral-only” or “natural expansion” Big Game Hunters, as screpdb sees it: every start, natural, and the center expansion as a labelled polygon.This allows things like narrating game events in terms of “expanded to their natural (mineral only)”.And because it knows who owns which base and where buildings sit, it can flag all these semantics:Cannon rush : a Photon Cannon built early, right in the opponent’s base.Manner pylon : a Pylon dropped inside the enemy’s mineral line to block mining (the impolite inverse of a proxy).Proxy gate : a production building planted forward in the enemy’s half of the map, but not inside a base.Offensive nydus : a Zerg Nydus Canal exit surfacing inside enemy territory as a real army insertion.Cliff drop : the Big Game Hunters classic of dropping a Siege Tank onto the cliff behind certain start locations, then shelling the mineral line from safety.💩 It doesn’t always get them right, but it’s promising so far. More people poking at them is exactly how they get sharper.💎 Which buildings were actually builtThe raw replay logs every misclick, re-placement, and cancelled order, so a single re-placed Gateway can look like three. screpdb cuts through that:From the unit-selection stream, it works out which building produced each unit.Then it drops any production building (Gateway, Barracks, Factory, and friends) that never actually produced anything.What’s left is the buildings that really stood and did something, which is what makes “2 Gate” reliably mean 2 Gate.💩 But a Gateway built just to wall a choke, one that never pumps a unit, wrongly disappears. Pick your battles 🤷💎 Build-order detectionTo read an opener precisely (building on the step above), screpdb runs a tiny per-player economy simulation over the first few minutes:It seeds the correct starting resources and supply, then walks the commands in order.It drops any command it couldn’t have afforded: not enough minerals, not enough supply.A backtrack pass fixes over-filtering, using Brood War’s own rule that it refuses orders without prerequisites.The result is realistic worker and building counts, so a “9 Pool” reads as a 9 Pool and not as inflated spam.💩 Build Orders are not just hard to infer (and imperfect to measure), they’re also hard to name. This is a work in progress. You can help improve this feature by filing an issue .💎 Skill proxiesBeyond APM, here are some worthy measurements available with replay data:Viewport multitasking: how often your screen jumps to a distant part of the map, a proxy for managing several fronts at once.Unit-production cadence: how steadily you pump army, rewarding an even stream over feast-and-famine bursts.First-unit efficiency: how quickly you actually use a new production building once it finishes, instead of letting it sit idle.💩 They’re proxies, not verdicts, and might need some tweaking. Happy to hear other ideas, but note that replays come with strict limitations.A few more favouritesFighting replay uncertainty was only half of it. The rest was building things that are genuinely useful, or just delightful, to look at.✨ Alliance and team-stacking detection. On melee games, alliances are manual, so who’s really on whose side is a live question. screpdb reconstructs the alliance timeline and flags when teams are lopsided, like a “3v2 stacked” the lobby never advertised.✨ Stage-and-watch. Find a game via filtering on the game list, click once, and screpdb stages that replay so you can watch it in the actual game client. Report to replay in one click.✨ Player fingerprints. It flags telling habits, like a player who never bound a hotkey, or never took a single upgrade or research the whole game.✨ Staying fast. All of this is only useful if it stays responsive over thousands of replays, so ingestion throughput is benchmarked automatically on every merge.Has AI made all of this?No, it enabled it. Throughout the 9 months I spent developing screpdb, AI kept getting better and better:And it allowed a backend engineer with no UI chops whatsoever to go from this: The old dashboard: functional, but a flat wall of numbers.To this: The current per-game summary: one .rep, fully unpacked into build orders, unit composition across early/mid/late game, spellcasts, and per-player stats.But even with this colossal swiss army knife, I had to fight the ways AI quietly gets things wrong. The code is correct, reads well, passes the tests, and is often quietly wasteful. It never shows up on three replays, only once you point it at thousands:It built the dashboard’s queries with no composite indexes, so every panel full-scanned the commands table (fixed ).It kept re-doing work it had already done: re-computing expert timings on every page load, re-scanning the command table for a signal it had already stored (#101 ).And some things it simply couldn’t do. No model just knows a game was a cheeky proxy 2-gate, so I watched and labelled 171 replays by hand to teach the detectors what’s real.Can you build on top of it?The dashboard is only the friendly face. Underneath, screpdb is a plain database with an API, so you can wire it into your own tooling:Ingest replays straight from the CLI (screpdb ingest).Run the server headless (screpdb dashboard --headless) and hit it programmatically.Every dashboard feature is exposed over a documented OpenAPI surface.There’s more in the developer docs .I’d love it if you’d check it out!It’s fully free 🍺 and open source. No donations needed, don’t buy me a coffee.It ships with a sample replay pack, so you don’t even need your own replays to see what it does:On Windows, install with Scoop :scoop bucket add screpdb https://github.com/marianogappa/screpdb scoop install screpdb screpdb-gui On macOS, install with Homebrew :brew install marianogappa/screpdb/screpdb screpdb On Linux, use the one-line installer:curl -fsSL https://raw.githubusercontent.com/marianogappa/screpdb/main/install.sh | sh screpdb Full instructions are on the project page .Feel free to let me know if you enjoyed it, and please file an issue if there’s a problem.But honestly, the tool is the least important part of this. What’s worth holding onto is people you’ll still be playing and laughing with decades from now. I hope screpdb helps a little. Keep playing together!screpdb is open source (MIT) and lives here . Built on icza/screp , without which none of this would exist.screpdb isn’t a competitor to RepMastered or vespene.gg, it’s complementary! Each do slightly different things. András helped me build screpdb through knowledge transfer, others helped betatesting too like 2Pacalypse- from TL.net. And I hope screpdb’s most useful features are rightfully stolen and improved upon 👍Discuss on TL.net and Reddit .
 L
↗
L
↗
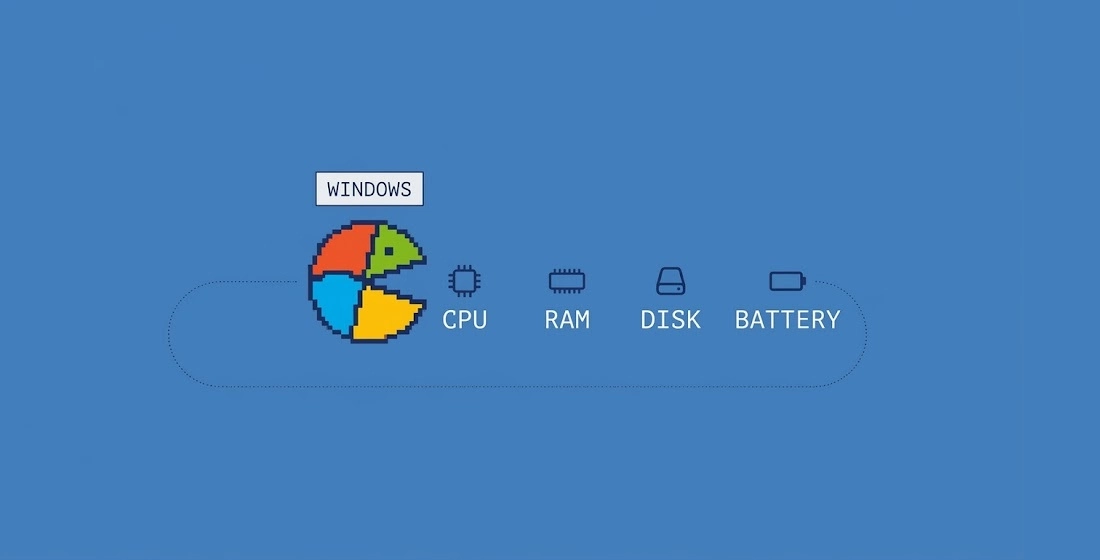
A few months ago, I decided to revive an almost decade-old laptop that had been sitting unused for years. So I performed a clean Windows installation, and set it up as a secondary machine for light tasks. It went largely as expected: the default Windows was fully lagged. What surprised me was how poorly a completely default Windows 11 installation would run on hardware that officially meets Microsoft’s requirements, except the CPU. Although the CPU might seem like the obvious culprit for such severe lag, I didn’t believe that narrative, and my subsequent test results didn’t corroborate it either.The hardware was certainly a limitation, but the operating system turned out to be a much larger contributor than expected. And this is not a new problem; discussions surrounding Windows resource consumption, background activity, and increases in hardware requirements have existed for years.For example, NVIDIA engineers presented measurements showing that Windows 10 could consume 15% more CPU utilization than Windows 7 under comparable workloads.Likewise, services such as Delivery Optimization have repeatedly attracted criticism due to their unnecessary impact on memory, disk and CPU consumption.Most recently, Microsoft published an article suggesting that 32 GB of RAM should be considered a “future-proof” configuration for gaming. The article was later removed.In the current scenario, I still agree with the number, not because modern software is becoming more powerful, but because it’s becoming less efficient, and nobody seems interested in fixing that.When operating systems, browsers, launchers, background services, telemetry pipelines, and web-based applications collectively consume more resources every year, recommending more RAM becomes the path of least resistance. It is almost a joke now. The implicit message is always the same: the problem is your hardware, not our software.This is everywhere. Apple’s Calculator leaked exactly 32 GB of RAM. Windows applications leak memory at the same scale.But the industry has already made its choice.The industry has quietly stopped asking why software requires so many resources and simply assumes hardware will continue scaling and compensating for bad software engineering. At this point, it’s just: generate slop, ship it, repeat. Ship broken, ship slow, as long as it ships. Optimization became optional over the years. There’s no penalty for bloat, no reward for efficiency. The consequences are finally showing.Almost every day, somewhere online, someone is describing their experience with Windows as heavy, bloated, or simply slow, regardless of whether they are running high-end or low-end hardware. Despite how common these complaints are, it is surprisingly difficult to find studies that attempt to measure them properly. Most discussions quickly become anecdotal:“Windows feels slower than it used to.”“Windows 11 is the fastest version of Windows yet.”“Tweaks improve performance.”“Tweaks do nothing.”Everyone seems to have an opinion. Very few people actually measure what they are talking about.This article started as a personal optimization project for my laptop, but eventually became an attempt to answer a simple question:Can my Windows performance issues be concretely demonstrated?The traces give us the answer.The following videos compare the user experience of a freshly updated, unmodified default installation against the Optimized+ configuration, running on the exact same hardware. These captures were made right after rebooting.Note: Optimized+ combines the Optimized scripts (which disable unnecessary services and tweaks system settings) and the Optimized+ script (which takes it further by disabling Update, Defender, and Store). Optimized+ is shown rather than Optimized because the usability experience between the two is essentially identical, making a separate video unnecessary.Default Windows Your browser does not support the video tag.As you can see in the System Informer boot counter, the default Windows took much longer before I could even start recording. The default Windows takes significantly longer to boot — around 3 minutes — and even after that, the taskbar takes another 1 to 2 minutes to appear. With only ~1.6 GB of free memory available even after post-boot, the OS has already consumed most of the available resources. Everything feels artificially laggy, slow to respond, visually sluggish, and imprecise. The kind of experience where you spend more time waiting for the OS than actually using it.Optimized+ Windows Your browser does not support the video tag.The optimized setup, by contrast, is genuinely usable. With ~2.7 GB of free memory available post-boot, the system has actual headroom for user workloads. Replacing the default taskbar with StartAllBack alone makes a huge visible difference — it appears instantly after boot, no delay. Compared to the default experience, it feels smooth. Hardware limitations still play a role, of course, but within that constraint, it’s the kind of result that makes you question the claim that optimization isn’t magic.The difference was significant enough to justify a deeper investigation into what Windows was actually doing during boot and idle periods, something more precise than recording a video. Manually reviewing each trace in WPA and cross-referencing RAMMap snapshots across multiple runs would have been impractical, so I built ETWView specifically for this study, a Python pipeline that automates WPA and RAMMap trace analysis across multiple runs and scenarios.The following section is where this study really begins.Tools And MethodologyHardwareLaptop: Samsung NP300E5M (approximately 10 years old) CPU: Intel Celeron 3865U (2 cores, 2 threads, 1.80 GHz) Memory: 4 GB DDR4 Storage: 500 GB SATA HDD (5400 RPM) Graphics: Intel HD Graphics 610 No overclocking or hardware-specific tuning applied.ScenariosAll tests were run on Windows 11 25H2 (build 26200.8655) Home Single Language, fully updated at the time of testing. Drivers were installed exclusively through Windows Update.DefaultFresh install of Windows 11, no modifications. ShareX and System Informer were installed in the end for recording the user experience video.OptimizedNTLite ISO using the LaptopBasics.xml preset, with OPT_Sv-Dv.reg, OptimizedPlan.pow, Optimized.bat, and StopSysMainHDD.bat applied to the system using MinSudo. Geek Uninstaller was used to remove Edge, Copilot and OneDrive, StartAllBack as the taskbar replacement.Optimized+Same as the Optimized scenario, with the addition of Optimized+.bat. ShareX and System Informer were installed in the end for recording the user experience video.CapturesBoot (boot-capture.bat)Records a boot trace using WPR’s Boot scenario. Runs 3 iterations automatically across reboots.General (general-capture_rammap.bat)Records a General trace (CPU, Disk I/O, Power profiles) with WPR and captures a RAMMap memory snapshot per run. Each run consists of 5 minutes of idle stabilization followed by 5 minutes of WPR recording, then a snapshot, totaling approximately 10 minutes. Runs 3 iterations across reboots.Battery (battery-capture.bat)Records a General trace using WPR’s Power profile. Runs 3 scenarios of 30 minutes each across 3 reboots, starting from 100% battery unplugged.Note: All scenarios — Default, Optimized, and Optimized+ — used the Balanced power plan as a baseline to ensure a fair comparison. Custom settings applied uniformly across all configurations:Turn off hard disk after: Never (on battery and plugged in) Turn off display: Never (on battery and plugged in)SourcesEverything used in this study is available for download: ETL traces, exported CSV files, optimization and capture scripts. Each script includes documentation explaining what it does.Note: RAMMap snapshots (.RMP) were excluded due to privacy concerns, but all exported CSV data used for analysis is included.ETWView GithubInternet Archive: Traces - OptimizationDropbox: Traces - OptimizationNotesMost of the optimizations applied in these scripts are based on reverse engineering undocumented Windows kernel and system-level features. Microsoft does not officially document many of these behaviors, so these modifications were discovered through analysis and testing. There are other undocumented Windows features and kernel-level behaviors that could be exploited further, but that’s beyond the scope of this study. The goal was to demonstrate what is achievable with a basic, practical setup, as described in the scripts themselves.The Optimized service configuration is not perfect for all use cases, but it was built and tested around a realistic use case: Microsoft Store, Windows Update, Windows Defender, Wi-Fi, microphone, camera, audio, and touchpad. For example, BitLocker was disabled because it is not used in this setup, but it could remain enabled with little to no impact on the results.Optimized+, on the other hand, disables almost everything that is possible and not strictly necessary, features like Update, Defender, and Store. That being said, nothing here is permanent or destructive. Service changes and renamed files can be reverted at any time, and the optimization scripts can be reapplied afterward. Nothing here should break anything, with that in mind, always review what you are running before executing it, and test in a controlled, isolated environment before applying to your main machine.Reading the ChartsHybrid MetricsSome charts in this study use additional metrics to rank and sort processes. When a chart displays Hybrid Metrics, the ranking applies multiple metrics in a prioritized sequence to identify which processes most significantly impact performance and how they respond to optimization.Data Aggregation PipelineChart values are produced through three stages:Within a single run, identical processes are summed.Across the 3 runs of each scenario, values are averaged.Processes are then ranked across all scenarios using the metrics below to select the top 25 most impactful entries.When multiple processes have the same value, a tiebreaker sequence is applied in order:mean_value — average value across all runs.peak_value — highest recorded value across all runs.appear_count — how many times the process appeared across runs. A process that shows up consistently ranks higher than one that appeared only once.process — alphabetical tiebreaker when all other metrics are equal.Svchost TableSvchost.exe is a generic Windows host process that can run multiple background services under a single process name, meaning that on its own, it tells you very little. To work around this, ETWView resolves each svchost instance to its actual hosted services, allowing them to be tracked and compared individually across scenarios. The dot indicates whether the same group of services was found in each scenario:● — the exact same svchost service group exists in this scenario. ○ — one or more services from this group exist in this scenario but are hosted inside a different svchost instance that does not appear in the chart. (blank) — none of the services from this group were found in this scenario.ChartsThe optimized configuration reduced battery drain from 2660 mWh to 2261 mWh during the observation period, corresponding to a reduction of 15.0%. The Optimized+ configuration showed identical results in this test set, though it is still worth noting that a slightly better result would likely appear in a longer test, since this case used only three 30-minute runs. It is also worth mentioning that power-saving features such as Dynamic Tick, Energy Estimation, Modern Standby, and many others were disabled in both Optimized and Optimized+, which likely has some negative impact on battery drain. It really makes me wonder about this posts: https://blogs.windows.com/windowsexperience/2024/04/22/reducing-the-environmental-impact-of-windows-devices/ & https://support.microsoft.com/en-us/windows/windows-update-is-now-carbon-aware-a53f39bc-5531-4bb1-9e78-db38d7a6df20.Boot time is broken into five sequential phases: Pre Session Init (kernel and early system initialization), Session Init (session manager and service initialization), Winlogon Init (logon processing), Explorer Init (desktop and shell initialization), and Post Boot (background startup activity after the desktop appears).Default Windows takes 193.3 seconds(~3.2 minutes) to boot. Explorer Init dominates, consuming 71.3 seconds (37% of total boot time). Post Boot adds another 46.7 seconds, and Winlogon Init takes 44.2 seconds. The system spends nearly three minutes simply initializing the desktop and background services.Optimized Windows boots in 68.1 seconds, a 2.8× speedup. Explorer Init drops to 6.5 seconds, and Post Boot compresses to 22.9 seconds. Session Init and Winlogon Init also improve but remain significant contributors.Optimized+ Windows reaches the desktop in 42.9 seconds, 4.5× faster than default. Explorer Init reduces to 3.7 seconds, Post Boot to 11.9 seconds. At this point, every phase is substantially faster.This directly corresponds to the video observations: where default Windows takes ~2 minutes before the taskbar appears, optimized configurations complete boot in under 70 seconds, with Optimized+ reaching usability in under 45 seconds.CPU Ready Time measures how long processes spend waiting for CPU access — the scheduler cannot run them immediately and they must queue.Default Windows accumulates 316.6 seconds of CPU ready time. The System process dominates with 84.2 seconds (26.6%), MsMpEng.exe adds 36.1 seconds, and multiple svchost instances exceed 13 seconds each. The scheduler is constantly switching context between competing processes.Optimized Windows reduces CPU ready time to 101.4 seconds, a 3.1× improvement. The System process drops to 26.8 seconds, and MsMpEng.exe compresses to 5.9 seconds. Processes like StartMenuExperienceHost.exe(Replaced by StartAllBack) and msedge.exe(Removed) no longer appear.Optimized+ Windows achieves 65.5 seconds, 4.8× better than default. System reduces to 19.9 seconds, MsMpEng.exe disappears entirely (Defender disabled), and overall contention becomes minimal.CPU Usage shows which processes consume the most processing power.Default Windows burns 26.0% CPU. MsMpEng.exe (Defender) dominates with 3.6%, System consumes 3.4%, and dwm.exe (desktop compositor) takes 2.8%. Additional contributors include explorer.exe (1.6%), msedgewebview2.exe (1.4%), and OneDrive.exe (1.2%).Optimized Windows drops to 11.2%, a 2.3× reduction. MsMpEng.exe compresses to 2.6%, System to 2.4%, and dwm.exe to 0.8%. OneDrive, SearchHost, and msedgewebview2 disappear entirely.Optimized+ Windows achieves 6.9%, a 3.8× improvement. System reduces to 1.9%, dwm.exe to 0.7%. MsMpEng.exe drops to 0% (Defender disabled). CPU load becomes minimal.CPU Wait Time measures how long processes spend blocked on I/O, locks, or kernel operations — time when they cannot execute even if CPU is available.Default Windows records 117.5 million milliseconds (32.6 hours) of aggregate wait time, with System at 18.9 million milliseconds (5.2 hours) and msedgewebview2.exe at 10.2 million milliseconds (2.8 hours). The system is heavily I/O-bound, with processes constantly blocking on disk and synchronization primitives.Optimized Windows drops to 36.7 million milliseconds (10.2 hours), a 3.2× improvement. System reduces to 7.5 million milliseconds (2.1 hours), and msedgewebview2.exe vanishes entirely. The reduction reflects fewer background tasks competing for disk and kernel resources.Optimized+ Windows achieves 19.7 million milliseconds (5.5 hours), a 6.0× improvement over default. System compresses to 5.9 million milliseconds (1.6 hours), and removed services eliminate much of the blocking contention.Default configuration wastes significant time with processes blocked waiting for I/O. Optimized configurations dramatically reduce this by eliminating unnecessary disk scanning, indexing, and service initialization.Note: CPU Wait Time is an aggregate metric. The reported value is the sum of wait times across all threads and processes, so it exceeds the actual trace duration.Disk IO Time measures how long processes spend waiting for disk operations — reads and writes.Default Windows records 3,300 seconds (55 minutes) of aggregate disk IO time. msedgewebview2.exe dominates with 1,058 seconds, System adds 891.5 seconds, and backgroundTaskHost.exe consumes 151.8 seconds.Optimized Windows drops to 133.8 seconds, a 24.7× improvement. msedgewebview2.exe vanishes entirely, System reduces to 79.6 seconds, and backgroundTaskHost.exe compresses to 11.5 seconds. Removing unnecessary services eliminates the majority of disk churn.Optimized+ Windows achieves 71.2 seconds, a 46.4× improvement. System compresses to 65.2 seconds, and most background disk activity is eliminated. Only essential system operations and ETDCtrl (touchpad driver) generate measurable disk IO.Note: Disk IO Time is an aggregate metric. The reported value is the sum of IO durations across all processes and operations, so it exceeds the actual trace duration.Disk Utilization measures the total volume of disk I/O activity.Default Windows records 3.5M units of disk utilization. The HDD is heavily saturated with writes from Windows Search indexing, file copies, and background service initialization.Optimized Windows drops to 170K, a 20.8× reduction. Removing Search and startup tasks dramatically cuts disk load.Optimized+ Windows achieves 82K, a 42.8× improvement. Disk activity becomes minimal, with only essential system operations and driver initialization generating measurable I/O.Hard Fault Bytes measures memory pages that had to be read from disk.Default Windows faults 742 MB from disk. MsMpEng.exe (Defender) dominates with 229.9 MB (31%), followed by explorer.exe (61.2 MB), and dwm.exe (49.2 MB).Optimized Windows reduces hard faults to 488 MB, a 1.5× improvement. MsMpEng.exe drops to 161.2 MB, and several background processes vanish entirely. Fewer concurrent services mean less memory pressure and fewer faults.Optimized+ Windows achieves 268 MB, a 2.8× improvement. Only core processes like LogonUI.exe (57.5 MB) and explorer.exe (55.5 MB) generate measurable disk reads.Hard Fault IO Time (Max) measures the maximum duration a single hard fault took — the longest pause while waiting for a page to be read from disk.Default Windows records a maximum hard fault time of 142.1 seconds aggregated across processes. backgroundTaskHost.exe experiences 22.1 seconds waiting for a single page fault, taskhostw.exe waits 19.2 seconds, and msedgewebview2.exe endures 12.7 seconds.Optimized Windows drops to 10.2 seconds, a 13.9× improvement. System reduces to 2.0 seconds maximum, MsMpEng.exe to 1.9 seconds. Removing unnecessary services eliminates the massive page faults.Optimized+ Windows achieves 3.7 seconds, a 38.4× improvement. System stays at 2.0 seconds, but all other significant contributors vanish. Hard faults become brief interruptions rather than multi-second hangs.Hard Fault IO Time measures the total cumulative time spent waiting for hard page faults.Default Windows accumulates 1,323 seconds (22 minutes) of hard fault wait time. backgroundTaskHost.exe contributes 149.7 seconds, taskhostw.exe adds 130.9 seconds, and msedgewebview2.exe contributes 118.5 seconds.Optimized Windows drops to 85.4 seconds, a 15.5× improvement. System becomes the primary contributor at 22.3 seconds, backgroundTaskHost.exe compresses to 12.5 seconds, and many processes vanish entirely. Fewer concurrent services dramatically reduce memory pressure and disk-backed faults.Optimized+ Windows achieves 27.8 seconds, a 47.6× improvement. System compresses to 18.2 seconds, backgroundTaskHost.exe vanishes entirely, and most page-heavy processes are eliminated.The Default scenario wastes 22 cumulative minutes of hard fault I/O. Optimized configurations reduce this to mere seconds, eliminating the underlying cause: too many processes competing for limited RAM and a slow HDD.Note: Hard Fault IO Time is an aggregate metric. The reported value is the sum of hard fault I/O durations across all processes and page fault events, so it can exceed the actual trace duration.Hard Faults measure the total count of page faults requiring disk access.Default Windows triggers 31,037 hard faults. MsMpEng.exe (Defender) generates 3,349 faults, explorer.exe generates 3,292, and LogonUI.exe contributes 2,634.Optimized Windows reduces hard faults to 21,403, a 1.45× improvement. MsMpEng.exe drops to 2,218 faults, explorer.exe to 3,134. Fewer background services mean less memory competition and fewer page swaps.Optimized+ Windows achieves 15,120 hard faults, a 2.05× improvement. MsMpEng.exe and OneDrive.exe vanish entirely. Only core system processes like explorer.exe (3,114) and LogonUI.exe (3,101) generate measurable page faults.Default configuration forces over 31,000 disk-backed memory accesses. Optimized+ configuration cut this in half.Aggregate CPU Utilization measures average CPU consumption.Default Windows consumes 18.7% CPU at idle. Background services, Windows Defender, Update checks, and indexing collectively burn CPU time constantly, even with no user interaction.Optimized Windows drops to 3.3%, a 5.7× reduction. Removing unnecessary services and disabling aggressive background scans dramatically cuts idle CPU consumption.Optimized+ Windows achieves 1.0%, a 18.7× improvement. With Defender, Update, and Store disabled, the system consumes CPU only for essential kernel housekeeping.Default configuration wastes nearly a fifth of CPU cycles on background activity. Optimized configurations reduce this overhead substantially, improving battery life and allowing thermal headroom for user applications.Note: Aggregate CPU Utilization is an average CPU usage metric. The reported value represents the combined CPU activity across all processors during the measured idle interval.Context Switch Count measures how many times the scheduler switches execution between threads — a source of scheduling overhead.Default Windows triggers 119.3K context switches. System dominates with 48.5K switches (41%), svchost (SysMain) contributes 10.6K, MsMpEng.exe adds 10.3K, and MemCompression generates 7.6K. The scheduler handles frequent switches between competing background tasks.Optimized Windows drops to 56.2K context switches, a 2.1× improvement. System compresses to 19.6K, MsMpEng.exe to 3.5K, and MemCompression vanishes entirely because of SysMain being stopped. Fewer concurrent services means the scheduler can let processes run longer with less interruption.Optimized+ Windows achieves 26K context switches, a 4.6× improvement. System drops to 7.8K, MsMpEng.exe and SecurityHealthService.exe disappear, and overall scheduler load becomes minimal.DPC/ISR Count measures Deferred Procedure Calls and Interrupt Service Routines — kernel-level interrupts.Default Windows triggers 78.6K DPC/ISR events. storport.sys (storage port driver) dominates with 41.4K interrupts (53%), reflecting constant disk I/O during background scanning and indexing. ntoskrnl.exe contributes 11.2K, dxgkrnl.sys adds 10.5K, and ndis.sys generates 4.1K.Optimized Windows drops to 47.3K DPC/ISR events, a 1.7× reduction. storport.sys compresses to 5.1K, reflecting dramatically reduced disk activity. ntoskrnl.exe actually increases to 20.5K, but overall interrupt load drops significantly.Optimized+ Windows achieves 31.7K DPC/ISR events, a 2.5× improvement. storport.sys compresses to 2.5K. ntoskrnl.exe remains at 19.3K, and dxgkrnl.sys drops to 220 interrupts.Default configuration hammers the kernel with disk-related interrupts. Optimized configurations cut this substantially by eliminating background disk activity.DPC/ISR Duration measures the longest time a single interrupt handler takes to execute.Default Windows records 5.88 ms maximum interrupt duration. ndis.sys (network driver) and ntoskrnl.exe (kernel) each reach 0.9 ms, tcpip.sys reaches 0.8 ms, and ACPI.sys reaches 0.6 ms. While these are individually brief, they accumulate into noticeable pauses.Optimized Windows drops to 2.82 ms, a 2.1× improvement. ndis.sys compresses to 0.8 ms, ntoskrnl.exe and tcpip.sys drop to 0.3-0.5 ms. Overall maximum interrupt latency is cut roughly in half.Optimized+ Windows achieves 2.42 ms, a 2.4× improvement. ndis.sys remains at 0.8 ms (network driver), but most other handlers compress to 0.1-0.3 ms. Maximum interrupt latency decreases significantly.DPC/ISR Duration (Sum) measures the total cumulative time spent in interrupt handlers — the aggregate CPU time consumed by all kernel interrupts combined.Default Windows accumulates 5.66 ms in interrupt handler execution. ndis.sys contributes 0.9 ms, ntoskrnl.exe adds 0.9 ms, tcpip.sys consumes 0.8 ms, and storport.sys takes 0.5 ms. Over extended periods, this accumulates into significant CPU overhead.Optimized Windows drops to 2.6 ms, a 2.2× improvement. ndis.sys compresses to 0.6 ms, tcpip.sys to 0.5 ms, and most other handlers become negligible. Reduced disk activity directly cuts storage-related interrupt overhead.Optimized+ Windows achieves 2.24 ms, a 2.5× improvement. ndis.sys remains at 0.6 ms, but storport.sys compresses to 0.1 ms, and most other handlers vanish.Default configuration spends 5.66 ms per observation period in kernel interrupt context. Optimized configurations cut this in half, reclaiming CPU cycles for user-mode execution and reducing the time the kernel spends servicing disk and network interrupts.Disk IO by Type measures disk I/O time during normal operation — how long processes spend waiting for disk reads and writes.Default Windows accumulates 158.1 seconds of disk I/O wait time. svchost (SysMain) dominates with 71.9 seconds (45.5%), reflecting constant background tracing and file access prediction. System contributes 23.7 seconds, provtool.exe adds 17.6 seconds, and mscorsvw.exe (JIT compilation) consumes 15.0 seconds. Background indexing and pre-caching drive constant disk churn.Optimized Windows drops to 17.2 seconds, a 9.2× improvement. svchost (SysMain) vanishes entirely (stopped), and System compresses to 3.5 seconds. MsMpEng.exe and most background services no longer generate measurable disk I/O. Stopping Sysmain and background optimization eliminates the majority of idle disk activity.Optimized+ Windows achieves 9.7 seconds, a 16.3× improvement. System remains at 3.4 seconds, but Defender and additional background services are eliminated. Disk I/O activity becomes significantly reduced.UI Delays measure moments when the system becomes unresponsive — freezes, stutters, or lags. Only 16 processes are shown because those are all the processes with captured delays.Default Windows accumulated 460.5 seconds of cumulative UI delay across all processes. A single process, backgroundTaskHost.exe, accounted for 390 seconds (85%) of that total. Additional significant contributors included ngen.exe (25.3s), SystemSettings.exe (20.4s), and msedgewebview2.exe (15.0s).Optimized Windows reduced total UI delay to 2.5 seconds, a 181× reduction. backgroundTaskHost.exe vanished entirely. Only MpCmdRun.exe (1.6s) and a handful of svchost instances contributed measurably.Optimized+ Windows eliminated UI delays, recorded 0 seconds of observable freezing.In practical terms: where default Windows would freeze repeatedly for half a second or longer during interaction, the optimized configuration produces imperceptible delays, and the aggressive Optimized+ configuration produces little to none.Memory by PFN State shows how Windows allocates the device’s 4 GB of RAM across different page states: Active (in use), Standby (reclaimable), Modified (pending write), and Free (completely unused).Note: PFN (Page Frame Number) is a Windows internal tracking system for physical memory pages.Default Windows keeps 2,364.8 MB active in memory, 59% of total RAM. An additional 1,466.1 MB sits in Standby (reclaimable pages). The device is memory-constrained by default.Optimized Windows reduces active memory to 1,327.5 MB, a 1.8× improvement. Standby compresses to 780.4 MB. Total utilization drops to 2.2 GB, freeing 1.8 GB for user applications and caching. Eliminating background services and indexing dramatically reduces memory footprint.Optimized+ Windows achieves 760.9 MB active, a 3.1× improvement over default. Standby compresses to 390.8 MB. Total memory consumption drops to 1.2 GB, leaving 2.8 GB available for user workloads. With Defender, Update, and Store disabled, the base system footprint becomes minimal.Default configuration wastes nearly 2.4 GB of active RAM on background services. Optimized configurations reclaim this memory, improving available headroom for user applications.Memory by Use Type breaks down RAM consumption across different categories: Unused (truly free), Mapped File (DLLs and libraries), Process Private (memory allocated by running services), System PTE (page table entries for mapping), Paged Pool (kernel memory that can be paged out), Nonpaged Pool (kernel memory that must stay in RAM), Shareable (memory shared between processes), and Page Table (memory used for managing virtual-to-physical address translations).Default Windows has only 114.4 MB unused memory; this scenario is critically memory-constrained. Mapped File consumes 2,015.5 MB (DLLs, executables, file caches), and Process Private uses 1,184.9 MB (background service allocations). Combined, 3.2 GB is committed, leaving almost no headroom for user applications.Optimized Windows frees up 1,795.2 MB unused memory, a 15.7× improvement. Mapped File compresses to 1,128.2 MB, and Process Private drops to 659 MB. By removing unnecessary services and DLLs, the system reclaims 1.7 GB of available memory for user workloads.Optimized+ Windows achieves 2,824 MB unused, a 24.7× improvement. Mapped File compresses to 649.8 MB, Process Private to 150.9 MB. The base system footprint becomes minimal.Private Working S