 Link preview
Theoretical BTC chart
This monthly chart shows the 4 year cycle for btc and probably for most altcoins, resistance for top till now is a straight line, 2025 peak was perfect aligned with 2017/2021 peaks and surprisingly the support line is actually a curve going upward?, bottom points being 2018, 2022 and 2026 towards end of year. From chart a 30% drop may come with a solid floor of 40-45k$ (oct/nov). So a possible monthly bearflag may appear to mirror the bullflag. From resistance line the top for next cycle is 2029 with 180k$ and a possible drop to 70k$ in the upcoming year. Not sure how relevant this chart is but keep in mind this possible scenario:). Also dont know how AI bubble will affect the cycle. submitted by /u/JiZhangYue [link] [Kommentare] reddit.com · reddit.com
Link preview
Theoretical BTC chart
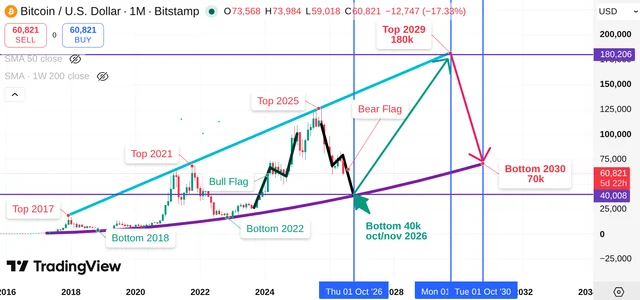
This monthly chart shows the 4 year cycle for btc and probably for most altcoins, resistance for top till now is a straight line, 2025 peak was perfect aligned with 2017/2021 peaks and surprisingly the support line is actually a curve going upward?, bottom points being 2018, 2022 and 2026 towards end of year. From chart a 30% drop may come with a solid floor of 40-45k$ (oct/nov). So a possible monthly bearflag may appear to mirror the bullflag. From resistance line the top for next cycle is 2029 with 180k$ and a possible drop to 70k$ in the upcoming year. Not sure how relevant this chart is but keep in mind this possible scenario:). Also dont know how AI bubble will affect the cycle. submitted by /u/JiZhangYue [link] [Kommentare] reddit.com · reddit.com
This monthly chart shows the 4 year cycle for btc and probably for most altcoins, resistance for top till now is a straight line, 2025 peak was perfect aligned with 2017/2021 peaks and surprisingly the support line is actually a curve going upward?, bottom points being 2018, 2022 and 2026 towards end of year. From chart a 30% drop may come with a solid floor of 40-45k$ (oct/nov). So a possible monthly bearflag may appear to mirror the bullflag. From resistance line the top for next cycle is 2029 with 180k$ and a possible drop to 70k$ in the upcoming year. Not sure how relevant this chart is but keep in mind this possible scenario:). Also dont know how AI bubble will affect the cycle. submitted by /u/JiZhangYue [link] [Kommentare]
Comments