Channels



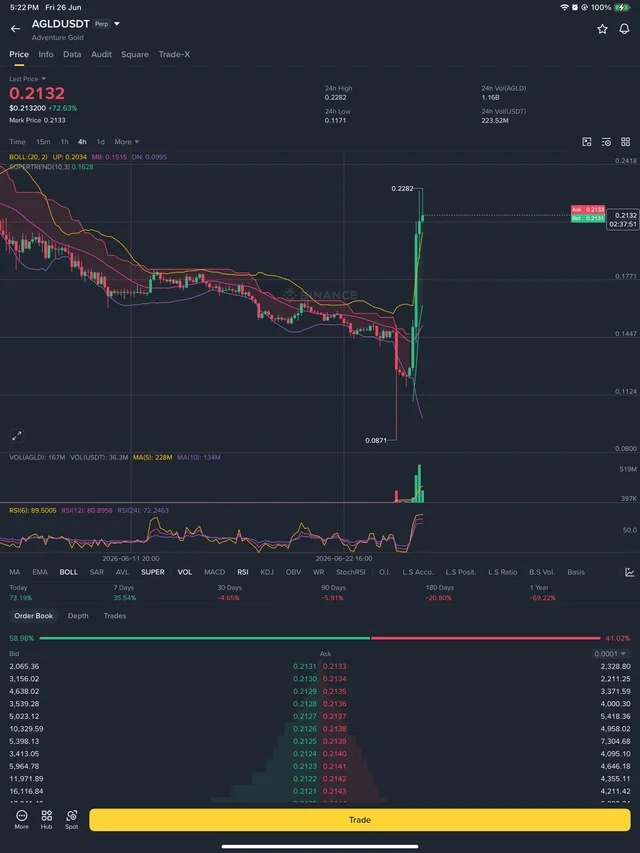
These kind of pumps, with no catalyst, just random pump from oversold conditions, are very risky…like there is nothing to price in, it’s a game of musical chairs, whoever is sitting at the end, is screwed. Yet I see social media, shilling this, like it’s some new crazy token with insane value. Narrative is, it’s going to 1 dollar…which is very unlikely. This repeats every day, and everyone with some knowledge knows, this is garbage…this pump is just to clear the late shorts! Why people fall prey to this? It baffles me, like most alt coins are garbage and go to 0, people know and they chase this, when nothing has changed making this token worth 70% more… submitted by /u/Bazaruta [link] [Kommentare]
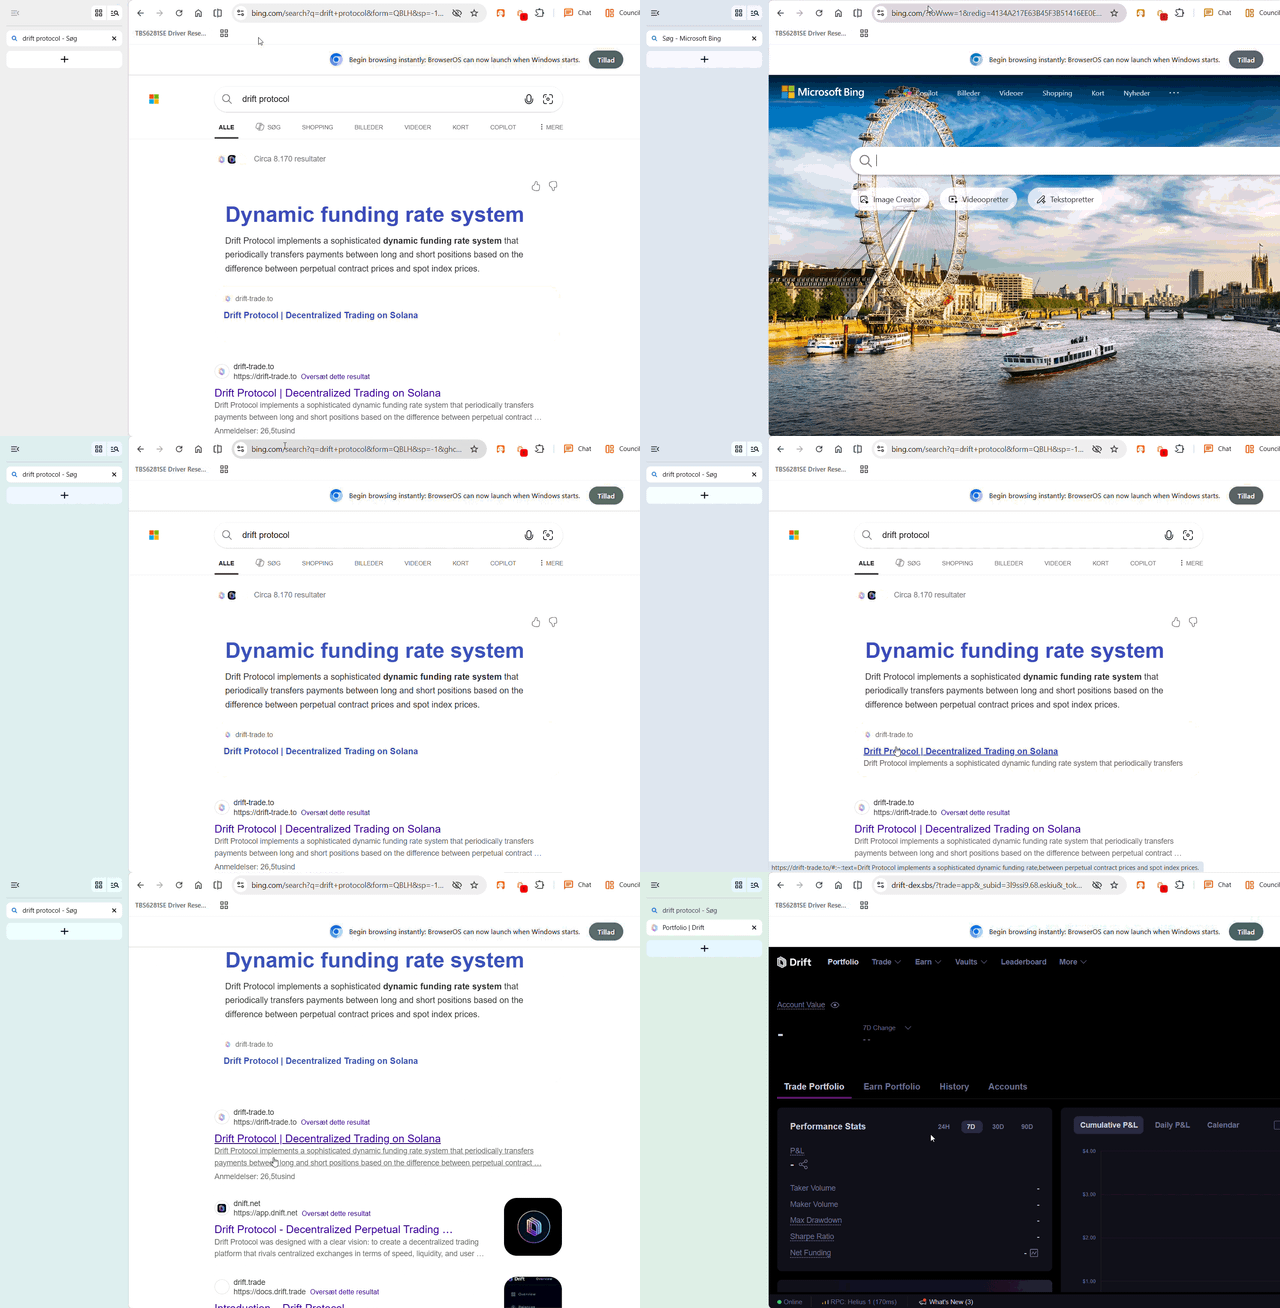
Scammers seem to have been able to add html/css to ads on Bing, so the first search result under their ad is also a phishing link. The code: https://pastefox.com/6vpa59 submitted by /u/BartAfterDark [link] [Kommentare]
Scammers somehow added html/css to their ads on Bing Search, so the link you see under the ad is also a phishing link. Code: https://pastefox.com/6vpa59 Gif of what is happening: https://imgur.com/a/2MGSqAc submitted by /u/BartAfterDark [link] [Kommentare]

I’m attending the Automate Show in Chicago and tested the teleoperation solution on display at the Universal Robots booth. When it comes to physical intelligence, data collection is a critical component. Today the industry uses a variety of acquisition methods including VR systems and optical motion capture. Teleoperation remains a highly practical approach for data collection thanks to its reliability and intuitiveness. What do you think? submitted by /u/No_Challenge_3410 [link] [Kommentare]

Tired of paying $30–$50/month just to see a company's ratios or balance sheet from 10 years ago, so I built StockNest. Completely free, no account required with 120+ metrics https://stocknest.app/ Data comes straight from SEC EDGAR filings with reconciliation passes to keep the numbers accurate and consistent. What it includes: Compare : chart any combination of metrics across up to 5 tickers simultaneously. 120+ metrics across income statements, balance sheets, cash flows, valuations, and margins. TTM, quarterly, and annual. 2Y / 5Y / 10Y / All-time ranges go back +25 years. Overview : Per-ticker overview with a weekly price chart (5Y/10Y range), TTM multiples, 5Y median metrics, historical valuation percentile rankings and percentile bands (0th/25th/50th/75th/100th), valuation range bars (P/E, P/S, P/OCF, P/FCF) with Undervalued / Fairly Valued / Overvalued verdicts, and a 52-week range. Insider trading transactions and analyst recommendations Score : A composite score across Profitability, Management, Growth, and Solvency. The score badge color is determined by the lowest-scoring category, making potential risk areas immediately visible DCF : pre-filled from historical data. EPS, FCF/share, or OCF/share. Tune growth rate, decay, terminal multiple, and discount rate. 5Y or 10Y horizon. Non-USD companies show everything in their reporting currency so the comparison stays apples-to-apples. Screener : filter by 25+ valuation, profitability, return, and health metrics. Sortable results, click any ticker to jump straight into a comparison. US-listed companies only for now. submitted by /u/rebel-capitalist [link] [Kommentare]
Ive sold everything at 110K and just recently started buying back below 60K. I plan on going more aggressively the lower we go and I believe that we bottom around 40-50K, thats where I will really heavily start buying. There are prices I would beat myself up if I had missed. Buying only BTC ETH and LINK. (70 20 10) While yes, I dont think we have bottomed, I am more than happy to start accumulating at these prices. No, I dont intend to full portfolio buy, I will gradually start buying each month from now on or the further we go I add more. I see soo many people saying “bitcoin is dead” and wont recover, I think that is because they are sitting on incredibly big losses. Always remember that its a good time to buy when theres blood in the street. We have already dropped 50%. Im only buying with what I can afford to lose so even if we were to HYPOTHETICALLY drop a further 50% it wouldn’t be the end of the world. Heck it would be a buying opportunity (That I hope and pray to be possible - even though its HIGHLY unlikely!) submitted by /u/Away-Ant7779 [link] [Kommentare]


Here is a scammer based in india promising high returns by pretending to be an american. He promises high returns through pump and dump scheme and tries to assure you by sending links of various types of high value transactions he made on the blockchain. Keep reporting his account until he gets banned from reddit permanently. submitted by /u/dorkymammal [link] [Kommentare]
The amount of Litecoin actually available to the market is much smaller than the total supply suggests. Data shows that more supply is being held for longer periods of time. 44% hasn't moved in over 1 year 16.5% hasn't moved in over 5 years 11.8% (9M) hasn't moved in over 7 years This means the amount of $LTC actively circulating or realistically available to the market is meaningfully lower than the circulating supply figure alone would imply. The data also shows that the active portion of Litecoin circulating is doing significant economic work. Over the last 30 days, adjusted payment value totaled roughly 522M LTC, averaging about 17.4M LTC per day. That daily average is larger than the entire supply cohort that has moved within the past 3 months, indicating that the active portion is supporting substantial transaction activity relative to its size. This doesn't mean each LTC is unique across every transaction, but it does show that the available float is being used heavily. This also isn't a price forecast, but it's an important market structure observation. As new issuance of this digital silver continues to decline, supply and demand analysis should account for both available float and the level of transaction activity that float is already supporting, not just total circulating supply. https://preview.redd.it/1du0ywbano9h1.png?width=1600&format=png&auto=webp&s=94cded943d23cbc1694787678d510a00ce0542c8 https://preview.redd.it/2jdbno9bno9h1.png?width=1600&format=png&auto=webp&s=3670e80ed891c81eaf2662b688b0623acddad616 submitted by /u/omieds [link] [Kommentare]
As of this week, both the Bitcoin Power Law chart and the Bitcoin Rainbow chart (now on its 5th version) have broken through the bottom. Both of them have always grossly overestimated BTC price and underestimated the diminishing returns of each cycle. Bitcoin cycles have diminishing returns Cycle 2: 50x gain Cycle 3: 20x gain Cycle 4: 3x gain Cycle 5 (just ended): 2x gain (1.7x inflation-adjusted) Returns converted to 4-year CAGR: Cycle 2: 170% Cycle 3: 110% Cycle 4: 32% Cycle 5 (just ended): 19% (14% inflation-adjusted) The current Cycle 6 will likely only have 1.4x to 1.6x, which is roughly 9-12% CAGR. Beyond that, BTC price returns are no better than S&P 500 returns, but with much more risk. Within a couple of cycles, not only will the S&P 500 have less risk than holding BTC, but the S&P 500 will also have higher returns than holding BTC. A lot of crypto investors are going to leave. So if you think THIS bear market sucks, good luck surviving the next 2 cycles. It's going to be worse. Saylor designed STRC expecting 30% CAGR for Bitcoin. I hope he's ready for far, far lower returns. (There is one silver-lining: This diminishing returns analysis is based on cycle highs. The cycle lows for this cycle are still around 30% CAGR as of the start of June 2026, but that's likely because the cycle isn't over yet and we haven't hit the bottom. If BTC falls to $30-40k before the end of this cycle, then the returns will be just as bad as the cycle high predictions.) submitted by /u/HSuke [link] [Kommentare]