Channels

5/27/2026 · 3,109 views Why does tsgo use so much memory? If you run tsgo on decently sized Typescript project, it’s not uncommon to see it using gigabytes of memory. Why is that? The short answer is: when multi-threading, tsgo makes a type checker per thread each type checker has its own state (types, symbols, etc.) this state is not shared as synchronizing it between threads is costly so each type checker often allocates duplicate, redundant memory in addition, allocated types are literally never freed1 It’s not uncommon for Typescript projects to have: several thousand Typescript files libraries like Zod, tRPC, Drizzle which result in many, many type instantiations recursive generic types which product a lot of transient types which are never freed When running tsgo on a large Typescript project, these type creation patterns compound and result in a lot of duplicated or unused memory. Let’s dig deeper. Heap analysisλ Let’s first get a breakdown of the heap so we can see what’s taking up so much memory. I’ll run tsgo on a large nextjs project with Zod, tRPC, Drizzle, all the good stuff that makes the typechecker do work. Including node_modules, it’s about 7k .ts files. We can use Go’s runtime/pprof package to capture peak heap snapshots and the pprof tool to tell us which functions allocated the most memory with the -inuse_space flag. If we categorize them by AST, typechecker etc. we see this: Total live heap: 1471.9 MB pprof writer self-overhead: 75.2 MB real live data: 1321.5 MB MB pct Family ────────────────────────────────────────────────────────────────────────────── 594.72 45.0% AST arenas (parser-allocated) 399.12 30.2% Checker (type/signature computation) 121.79 9.2% LinkStore (per-node/per-symbol caches) 63.38 4.8% OS / syscall / file I/O 62.58 4.7% Binder (symbol/flow declarations) 22.33 1.7% Parser (intern maps, etc.) 20.24 1.5% pkg: collections 15.54 1.2% Checker arenas 13.46 1.0% AST utilities 6.58 0.5% Compiler / module resolution 1.10 0.1% pkg: core 0.70 0.1% pkg: packagejson What sticks out at first glance is 45% of memory (600MB) is allocated for AST nodes. It sounds like a lot, but it’s actually expected for the bulk of the memory allocated by a compiler to be taken up by AST nodes. AST nodes also typically need to live for the duration of the compiler’s execution, so there’s nothing we can really do here. A lot of files means a lot of AST nodes! I’m more interested in the memory allocated by the typechecker (the Checker struct in the source). What happens if we run tsgo with --singleThreaded? Total live heap: 797.4 MB pprof writer self-overhead: 3.6 MB real live data: 790.2 MB MB pct Family ────────────────────────────────────────────────────────────────────────────── 522.95 66.2% AST arenas (parser-allocated) 63.37 8.0% OS / syscall / file I/O 62.63 7.9% Binder (symbol/flow declarations) 51.93 6.6% Checker (type/signature computation) 23.01 2.9% LinkStore (per-node/per-symbol caches) 22.51 2.8% Parser (intern maps, etc.) 16.78 2.1% AST utilities 16.15 2.0% pkg: collections 10.21 1.3% Compiler / module resolution 0.58 0.1% pkg: packagejson 0.10 0.0% pkg: core 0.01 0.0% ** unclassified ** The typechecker takes up only ~50MB instead of ~400MB! This strongly suggests to me that there is some overhead with multi-threading here. Let’s look at the typechecker deeper. The type checkerλ The way tsgo multi-threads typechecking is by creating a pool of Checker for each thread: // internal/compiler/checkerpool.go func newCheckerPoolWithTracing(program *Program, tr *tracing.Tracing) *checkerPool { checkerCount := 4 if program.SingleThreaded() { checkerCount = 1 } else if c := program.Options().Checkers; c != nil { checkerCount = *c } checkerCount = max(min(checkerCount, len(program.files), 256), 1) pool := &checkerPool{ program: program, checkers: make([]*checker.Checker, checkerCount), locks: make([]*sync.Mutex, checkerCount), tracing: tr, } return pool } When a Checker is created, it is given the entire Typescript program AST and all its files: // internal/checker/checker.go func NewChecker(program Program, tracer *Tracer) (*Checker, *sync.Mutex) { program.BindSourceFiles() c := &Checker{} c.id = nextCheckerID.Add(1) c.tracer = tracer c.program = program c.compilerOptions = program.Options() c.files = program.SourceFiles() c.fileIndexMap = createFileIndexMap(c.files) // ... more code } During typechecking and emitting diagnostics for a file, each file gets assigned to the next available Checker. Each Checker has it’s own state for type-checking (which we’ll see in more detail later). Here’s an example of duplicated work: File a.ts goes to Checker 1, it creates a bunch of types. File b.ts imports some type from a.ts and goes to Checker 2. Checker 2 has its own separate state, so it needs to recompute and re-allocate data for a.ts. From the pprof run I noticed the top allocating Checker functions were: Checker.newSymbol() (symbols) Checker.newObjectType() (types) Checker.instantiateType() (types) Let’s look at precisely what the data being allocated in each Checker. Duplicated typesλ Each Checker has a lot of stores for the many types that could be constructed: type Checker struct { stringLiteralTypes map[string]*Type numberLiteralTypes map[jsnum.Number]*Type bigintLiteralTypes map[jsnum.PseudoBigInt]*Type enumLiteralTypes map[EnumLiteralKey]*Type indexedAccessTypes map[CacheHashKey]*Type templateLiteralTypes map[CacheHashKey]*Type stringMappingTypes map[StringMappingKey]*Type cachedTypes map[CachedTypeKey]*Type cachedSignatures map[CachedSignatureKey]*Signature narrowedTypes map[NarrowedTypeKey]*Type assignmentReducedTypes map[AssignmentReducedKey]*Type discriminatedContextualTypes map[DiscriminatedContextualTypeKey]*Type instantiationExpressionTypes map[InstantiationExpressionKey]*Type substitutionTypes map[SubstitutionTypeKey]*Type reverseMappedCache map[ReverseMappedTypeKey]*Type reverseHomomorphicMappedCache map[ReverseMappedTypeKey]*Type iterationTypesCache map[IterationTypesKey]IterationTypes tupleTypes map[CacheHashKey]*Type unionTypes map[CacheHashKey]*Type unionOfUnionTypes map[UnionOfUnionKey]*Type intersectionTypes map[CacheHashKey]*Type propertiesTypes map[PropertiesTypesKey]*Type flowLoopCache map[FlowLoopKey]*Type flowTypeCache map[*ast.Node]*Type errorTypes map[CacheHashKey]*Type // and many more! } Remember that: this memory belongs to a single Checker and there’s no sharing of the data. allocated types never get freed This means there can be a lot of duplicated memory that sits around. To verify this, let’s start by creating a file with some code that builds tuples: type BuildTuple = T['length'] extends L ? T : BuildTuple; type TC = BuildTuple; declare const x: TC; export const c0 = x[0]; export const cLen: 100 = x.length; The BuildTuple type will recursively build a tuple type from the empty tuple type [] all the way to a tuple with 100 any’s in it ([any, any, ... any]). Each iteration of the recursion creates a new tuple and caches it forever2. If we create 4 files with the content as above and ran it through tsgo, we should see 100 tuple types created and duplicated across 4 typecheckers (and also 100 number literal types). Let’s see: single checker 4 checkers ───────────────── ───────────────────────────── tupleTypes 102 [102 102 102 102] → 408 numberLiteralTypes 101 [101 101 101 101] → 404 This illustrates two things: types will be redundantly created on different threads a recursive generic type can create a lot of transient types which take up memory This is just a trivial example. Imagine the level of duplication that could happen when typechecking many thousands of files. Duplicated symbolsλ In compilers, named things (identifiers for functions, variables, etc.) often get recorded in a layer of indirection called a “symbol”. Usually, this lets names be scoped (“foo” in the global scope and “foo” in function scope mean two different things) and also lets you give a stable handle to them in case you want to rename (e.g. minification). Each Checker stores a bunch of symbols: type Checker struct { // ... more code symbolArena core.Arena[ast.Symbol] // ... more code } Are symbols being duplicated a lot? I modified tsgo to dump the top symbol names (the string part of the symbol) when running 4 threads: tsgo --checkers 4 | Symbol | Kind | Count | | -------------- | -------- | -----: | | `at` | Method | 34,500 | | `_` | Property | 25,600 | | `name` | Property | 24,700 | | `value` | FuncVar | 22,800 | | `@@iterator` | Method | 22,300 | | `data` | Property | 22,100 | | `enumValues` | Property | 21,900 | | `columnType` | Property | 21,000 | | `dataType` | Property | 21,000 | | `generated` | Property | 19,500 | Let’s look at the at symbol count. If it decreases with single-threaded tsgo then that probably means other threads are duplicating it: tsgo --checkers 1 | Symbol | Kind | Count | | -------------- | -------- | -----: | | `props` | FuncVar | 16,800 | | `at` | Method | 14,600 | | `children` | Property | 10,400 | | `value` | FuncVar | 10,200 | | `@@iterator` | Method | 9,500 | | `className` | Property | 9,200 | | `data` | Property | 8,500 | | `forEach` | Method | 8,100 | | `map` | Method | 8,000 | | `find` | Method | 7,900 | So there’s about 20k more at symbols created when running tsgo with 4 threads! Let’s verify it by creating a little test file. The at symbol is from Array.prototype.at. We can force Typescript to create this symbol by creating an Array and doing any property lookup on it, this causes Typescript to resolve all members (and create their symbols)3 on the Array object: declare const arr: Array; export const len = arr.length; Now we can create 4 files with this exact same contents. If we run tsgo with --checkers 4 each file should go to a Checker and we’ll see if it duplicates the at symbol: --checkers 1 --checkers 4 ───────────── ────────────────────────────── total total c0 c1 c2 c3 at 1 4 1 1 1 1 So each checker duplicated the symbol for Array.prototype.at. Also note that new symbols are created for every new instantiation of a type parameter. So Array, Array, etc. will all get their own symbols for at and any other members. This is pretty standard and normal. But you can start to see how it could be easy for tsgo to duplicate a lot of symbols on other threads. Imagine your code creates some generic type with a lot of fields and methods, maybe for a data structure: type MyDataStructure = { field1: T; field2: string; // ... field100: string; } Each instantiation will create 100 symbols. And then perhaps if you import this type in many files, it’s highly likely that it will be seen and duplicated across more than one Checker. A real-world example is Zod objects. Zod’s method chaining API returns a ZodObject instantiated with different type parameters: const emailSchema = z.string().email().min(5).max(120).toLowerCase(); Each .string(), .email() etc instantiates some new ZodObject type and the property chaining causes Typescript to resolve and create symbols (as well as allocating the individual types!). There are similar APIs like Drizzle, tRPC that all do a similar thing, and when multiplied by multiple threads this leads to a lot of memory usage. Conclusionλ This was a fun dive into the tsgo source. How could memory usage be made better in the future? Garbage collecting types sounds promising, especially since Typescript types behave like regular values in a programming language. Transient types wouldn’t be bound to an AST node or anything and would get GC’ed. Persistent, shared data structures are used in FP languages which, like Typescript, have the problem of creating many transient values. This could help reduce memory usage for types like tuples etc. Another interesting place to look at is how the Zig compiler’s InternPool solves a similar problem with comptime values and types4. Here is my fork which contains scripts to process pprof’s data as well as some modifications to tsgo code to emit profiling data. Footnotesλ 1↩︎This may sound crazy at first, and it kind of is. Because Typescript types are turing complete, this feels like writing a program which never frees its memory. However, I can kind of see how it got to this point. It’s pretty standard practice for compilers to allocate AST nodes in arenas (which don’t get freed until end of program) since the AST will live pretty much for the duration of the compiler’s execution. Similarly, in compilers with types that are “normal”, you often associate the type to the AST node and once it’s associated with an AST node it lives forever because the AST does. However, with types like Typescript’s, which are turing complete and can have iterative recursion which produces many, many transient types, this may not be the best strategy. 2↩︎The getTupleTargetType() function creates a tuple and stores it in the tupleType of Checker. 3↩︎In Typescript’s typechecker, getting a property on an object causes it to resolve members on it which then calls instantiateSymbolTable(). 4↩︎I’m not an expert on Zig compiler internals but my understanding of InternPool is this: Typescript types are essentially compile-time values Zig has compile-time execution (comptime) that is also Turing complete like Typescript and produces a lot of compile-time values (types are also values in Zig’s comptime). Zig’s semantic analysis pass (which does comptime execution) also has a problem of multi-threading and sharing or duplicating data. Semal is currently single-threaded, but there are other AstGen threads which read its values. Zig’s solution is slightly inspired by RCU. Basically: threads can share data, readers are lock-free, and writers can update shared values without blocking readers. Each thread has it’s own thread local storage where it can place compile-time values There is a global list of “shards” which you can use to lookup which particular thread a value lives in (basically a map which maps hash of value -> (thread, index)) Each value is hashed to determine which shard it belongs to When you want to look up a value, you hash it, look it up in the shard which uses atomics, no locks When a thread creates a value, it stores it in it’s thread local store, and uses a writer mutex to update the corresponding shard This has a few performance characteristics: Reading requires zero locking, very fast Writing does require a lock, but only on the shard, and since the data is split into multiple shards it’s less contention than a single read/write mutex for example Zig comptime values are also immutable, so writing essentially happens only at creation time

Apple introduces Siri AI, a profoundly more capable and personal assistant powered by Apple Intelligence, with personal context, world knowledge, and onscreen awareness.
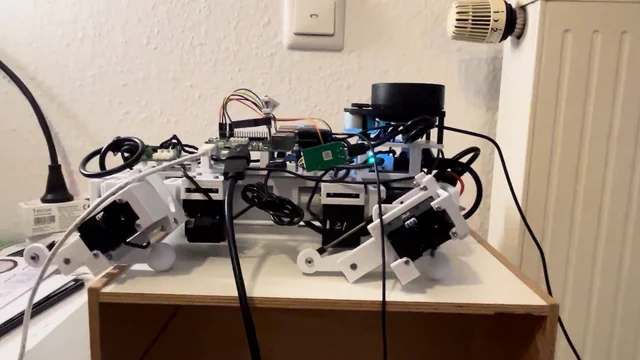
Honestly, I don't know how other people can do IMU balancing so elegantly; my PID oscillates like it's on life support. I have been tuning the PID the whole night, but then again, I don't have a lot of experience other than following some manuals, so any advice would be great! I am using BNO055 for IMU. Work in progress GitHub: https://github.com/SphericalCowww/CubicDoggo_06R Original Cubic Doggo: https://github.com/SphericalCowww/CubicDoggo submitted by /u/SphericalCowww [link] [Kommentare]
Just a machine that made you stop and think: "wow...somebody put a ridiculous amount of engineering into this". Could be anything.sometimes the most impressive machines are the ones that make incredibly difficult things look effortless. submitted by /u/hannimalki [link] [Kommentare]


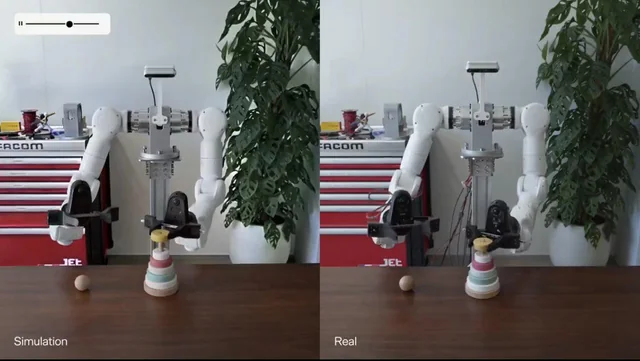
I would love feedback on the data quality and the 3D renderings specifically, because the renderings were the hardest part about getting this to work. Basically, Chaveta is a agentic dataset curation tool that allows you to submit a prompt and instantly receive a dataset for: - World models - Robotics (JSON Trajectories) - LLM Fine Tuning - Geological - Synthetic Tool Calling / LLM flows - Time series For the robotics path, you can also download to MCAP or simple JSON and we have a render tab that allows you to edit joints visually + we provide copy/paste scripts for importing the dataset into things like Transformers. Let me know what you think. submitted by /u/ComradePampers [link] [Kommentare]
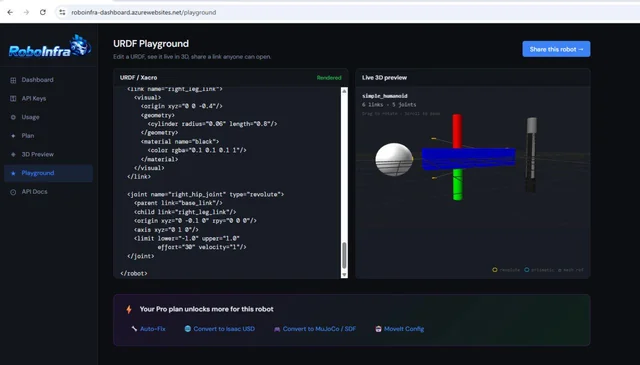
Hi everyone, I've been working on a browser-based URDF playground aimed at making robot development a bit easier. Steps: i) Paste URDF or Xacro directly into the browser ii) Instant 3D visualization iii) Shareable robot links iv) No ROS installation required Playground: https://roboinfra-dashboard.azurewebsites.net/playground Additional tooling: URDF/Xacro validation Auto-fix suggestions URDF → SDF conversion URDF → MJCF conversion URDF → USD conversion MoveIt configuration generation Mesh analysis GitHub Action integration Python SDK The goal is to make robotics workflows feel a little more like modern web development—open a browser, paste your robot description, and start iterating immediately. I'd really appreciate feedback from ROS, MoveIt, Isaac Sim, MuJoCo, and general robotics developers: What feature would make this genuinely useful in your workflow? What is currently missing from existing URDF tools? Any issues or suggestions after trying it? Thanks! submitted by /u/DateRealistic5066 [link] [Kommentare]
The Genesis sim video got me thinking: what does it actually take to build scenes like that (apart from gaussian splat part) with such accuracy, at scale? Asset and scene generation is one of the biggest bottlenecks in robot training. NVIDIA GR00T, Helix, HumanPlus, and ASAP all show the same pattern: more diverse scenarios lead to better sim-to-real transfer. But generating physically accurate objects and scenes takes time. Four platforms are working on this in 2026. Here's how they compare: 1. Rigyd: Agentic pipeline, best for on-demand scale and new types of objects Takes raw 3D (.glb, .fbx, .obj), images, or text and outputs calibrated OpenUSD + MJCF in ~2 minutes per asset with SimReady asset validator baked in. Generates full interactable scenes with per-object decomposition. Native Isaac Sim and MuJoCo support. Non-rigid and articulated objects are stated in the roadmap. The pipeline is agentic end-to-end, so no per-asset manual work. Good fit for teams that need to move fast with on-demand assets. 2. Lightwheel: High fidelity articulated objects, SimReady catalog Strong catalog of high-fidelity articulated assets and a SimReady library used by large enterprise customers. Per-asset visual and physical quality is high. USD and MJCF support via open-source converters. Good fit if you need a curated, validated catalog. Less flexible for new use cases or object categories outside their existing library. Catalog growth follows a curation model rather than an agentic pipeline. 3. NVIDIA Edify: Generative 3D, physics added separately Generates high-quality 3D meshes from text or image in under 2 minutes. Trained on licensed data, enterprise-safe. Tight Omniverse integration. The gap: it produces visual geometry, not SimReady assets. Physics, collision geometry, and USDPhysics schemas need to be added downstream before the asset is usable for robot training. Works well as an upstream step paired with a SimReady pipeline. 4. Moonlake: World modeling agent approach Acts directly inside Blender, automating the creation of articulated assets, physics-validated scenes, and complex environments rather than per-asset annotation. The approach is promising for research but production-grade Isaac Sim / MuJoCo integration is not there yet. If successful, world models could collapse scene generation and policy training into a single learning loop. What I think actually matters for sim-to-real transfer (ranked by impact): Per-object physics accuracy within the domain-randomization band Scene diversity (variation of scenes the policy sees during training) Visual fidelity (matters most for camera-only policies, less for contact-rich manipulation) How to choose: Need to scale across many object categories fast → Rigyd Need a validated catalog of articulated assets for known use cases → Lightwheel Need high-quality visual 3D in the NVIDIA ecosystem and will add physics downstream → Edify Researching end-to-end learned simulation → Moonlake For most teams the practical pattern is Rigyd for the long tail + hand-authored or Lightwheel assets for the few hero objects your scenario depends on. Both output standard OpenUSD/MJCF so they compose cleanly. Questions for the community: What's missing from this comparison? For those running training: where does asset prep actually bottleneck you? Image Credit: Genesis AI submitted by /u/yektabasak [link] [Kommentare]

We put together a robotics overview for business leaders, operators, procurement teams, investors, and executives who want to understand which robots are actually being deployed, which are still early, and where the industry is heading. The goal is not to make a technical ranking or a hype list. It is to explain the major categories of real-world robotics in a way that can be shared with people outside the robotics field. The overview covers: Boston Dynamics Spot — industrial inspection quadrupeds ANYbotics ANYmal — rugged inspection robots for energy, mining, chemicals, and heavy industry Agility Robotics Digit — logistics humanoids Figure 03 — general-purpose humanoids and embodied AI Boston Dynamics Atlas — all-electric humanoid mobility and manipulation Tesla Optimus — vertically integrated humanoid robotics strategy Unitree G1 — lower-cost humanoid research and education platform Universal Robots UR Series — collaborative robot arms for machine tending, packaging, assembly, and small manufacturers Amazon Proteus — autonomous mobile warehouse robots for logistics facilities Intuitive da Vinci 5 — surgical robotics and robotic-assisted surgery The main article is the general overview, and we are also building individual deep dives for each robot so non-technical readers can understand the business case, deployment maturity, pricing context, use cases, risks, and hardware/software stack behind each system. The audience is intentionally non-technical. It is meant to be something robotics professionals, engineers, founders, or operators can share with leadership teams, clients, or colleagues who need a grounded introduction without reading a robotics textbook. Disclosure: I’m affiliated with Black Scarab, where the article is published. The article is free to read and does not require signup. Most of the deep dives are already live. The Intuitive da Vinci 5 deep dive is still in progress and will complete the series. Full overview: https://www.blackscarab.ai/insights/top-10-robots-edge-ai-automation-humanoid-robotics submitted by /u/rgc4444 [link] [Kommentare]
Hey everyone, I'm deep into robotics simulation, specifically focusing on Reinforcement Learning (RL) and Deep Learning (DL) workflows. My hardware setup is an M4 MacBook Air (16GB unified memory). Initially, I wanted to use NVIDIA Isaac Sim/Isaac Lab because of its photorealistic graphics, advanced sensor simulation, and massive parallelized RL support. However, since Isaac Sim relies heavily on NVIDIA RTX hardware and CUDA, running it locally on Apple Silicon isn't feasible. I really want a local development environment rather than constantly relying on cloud instances. I need a simulation software that satisfies these core requirements: High-Quality Graphics: Clean rendering, realistic physics-based lighting, and solid sensor noise modeling for computer vision/DL perception models. Robust RL/DL Support: Seamless integration with Python ML ecosystems (like PyTorch, Stable-Baselines3, or JAX), OpenAI Gym/Gymnasium wrappers, and fast parallel simulation stepping. Apple Silicon friendly: Runs natively or optimized on macOS, making good use of the M4 chip and unified memory architecture without hitting x86_64 or CUDA bottlenecks. What are the best alternatives for this exact setup? I’ve looked into MuJoCo (especially with its native macOS build and the JAX-based MuJoCo XLA / MJX for acceleration, though I'm curious how well XLA handles Apple Silicon for parallel envs). I've also considered Unity with ML-Agents, which utilizes Apple's Metal API for incredible graphics and handles RL workflows beautifully on Mac. Has anyone successfully built a high-graphics RL/DL robotics pipeline on an M4 Mac? Which simulator did you choose, and what did your Python bridge look like? submitted by /u/Risheyyy [link] [Kommentare]
The deadly Ebola outbreak isn't the only thing causing concern for health workers in Congo. Rumors and disinformation are hindering efforts to contain the virus. The patterns are well-known — and could be confronted.
Paste a raw file into an agent prompt and half your context window is gone before a fix is written. One CSV line per issue beats 500 raw lines every time.